

Von der Rohdatei zum publikationsreifen Diagramm in einem Durchlauf
Laden Sie die Dateien beliebiger Zelltester und Potentiostaten und erhalten Sie beschriftete, vergleichbare Diagramme in Origin: für Batterien, Brennstoffzellen, Elektrolyse, Redox-Flow- und Sicherheitstests.
- Läuft direkt in OriginLab Origin
- Unbegrenzte Nutzerzahl bei Auswertungspaketen
- Ihre Messdaten bleiben bei Ihnen
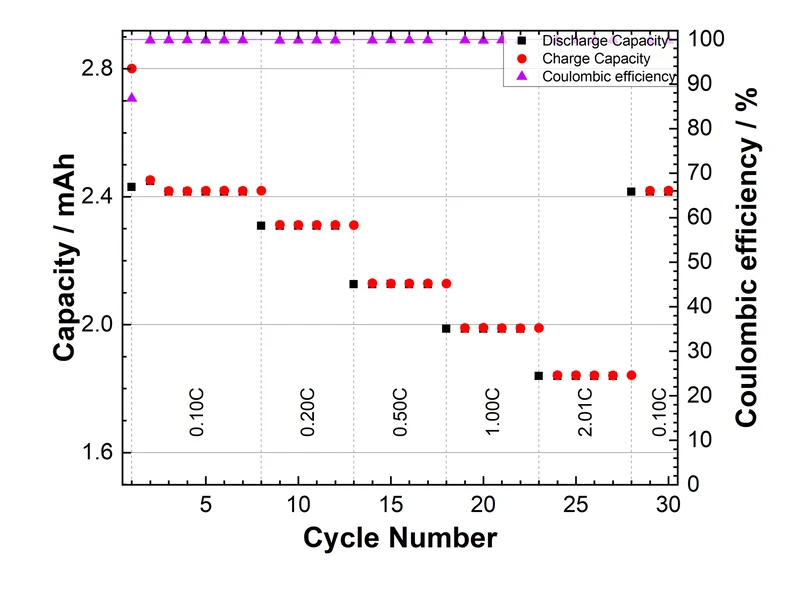
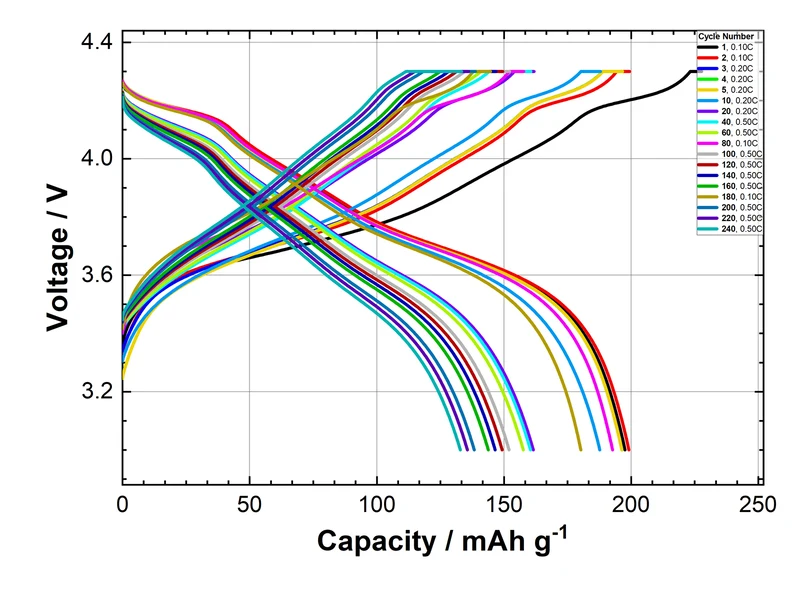
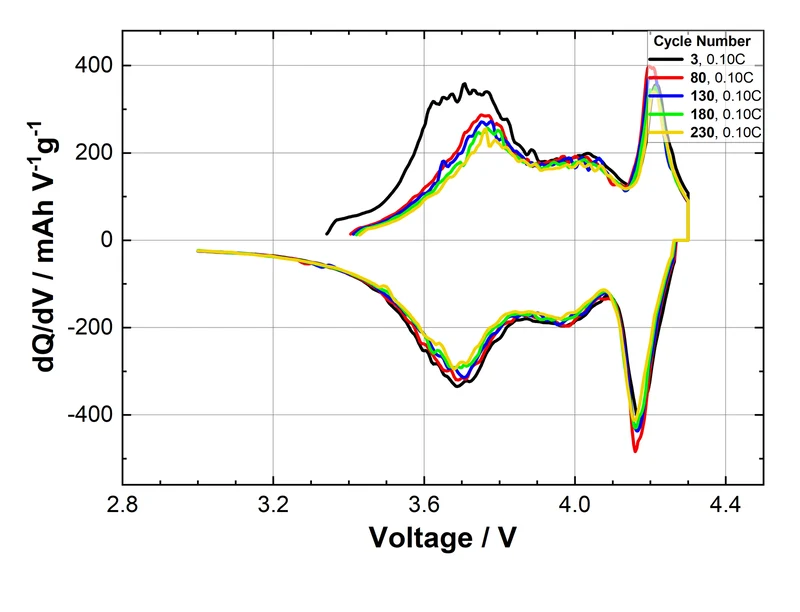
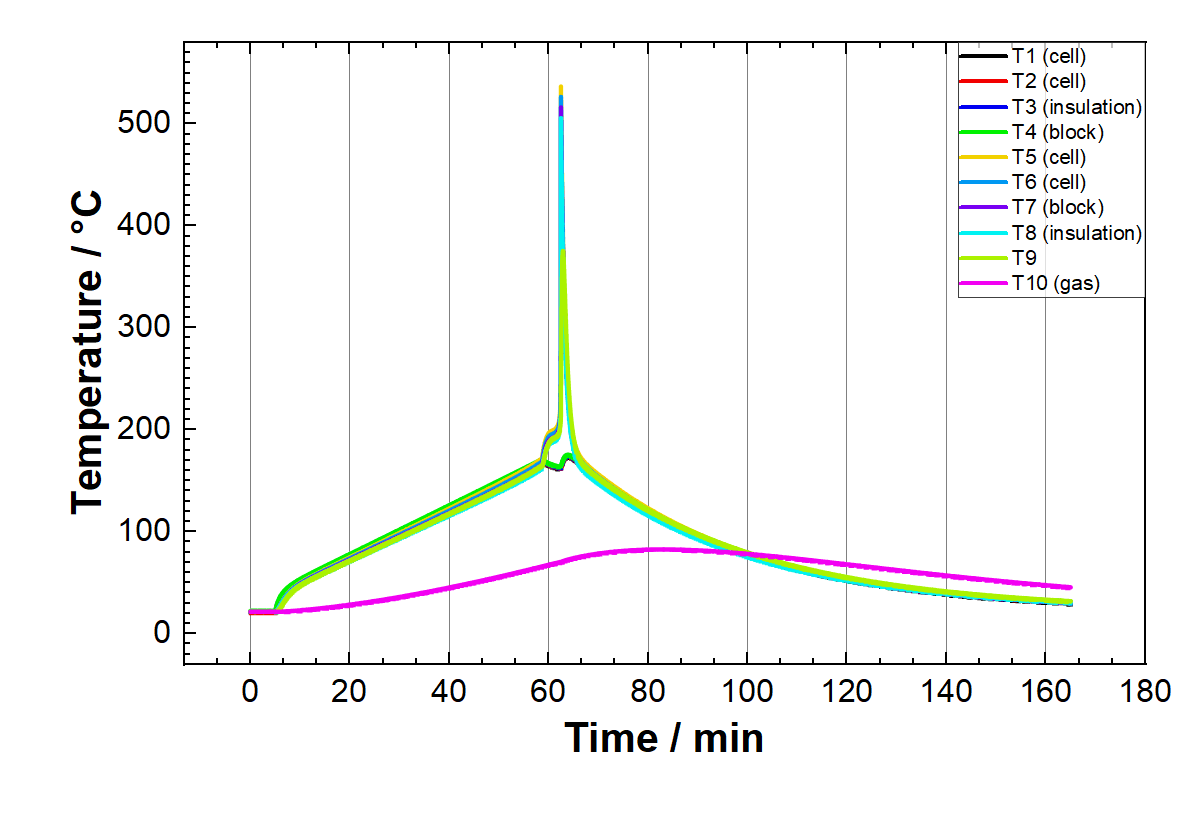
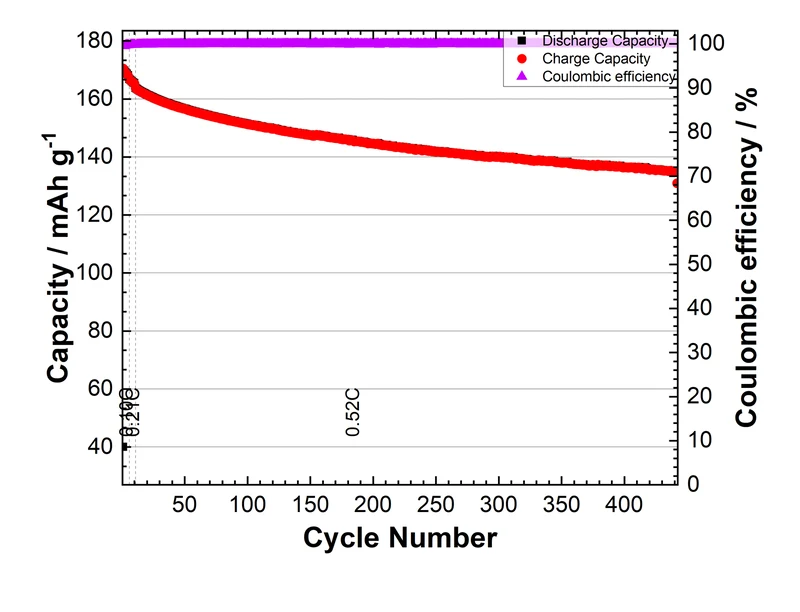
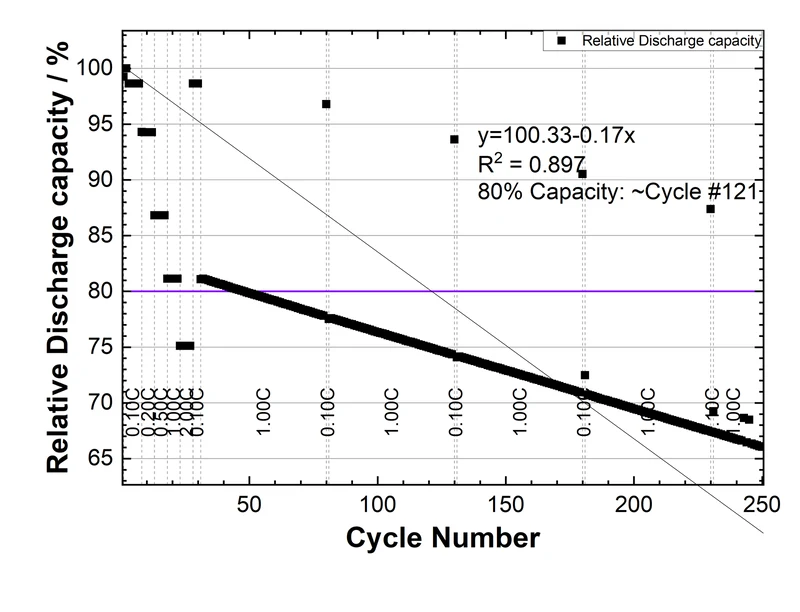
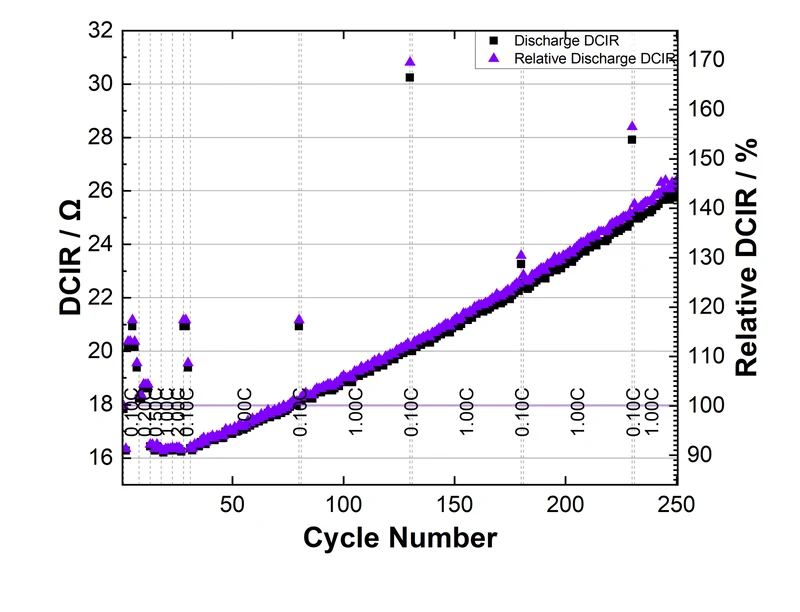
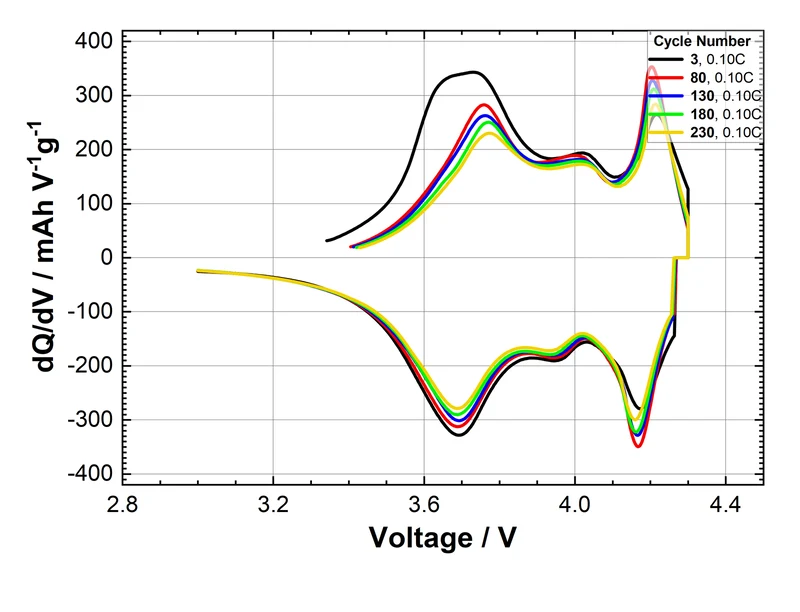
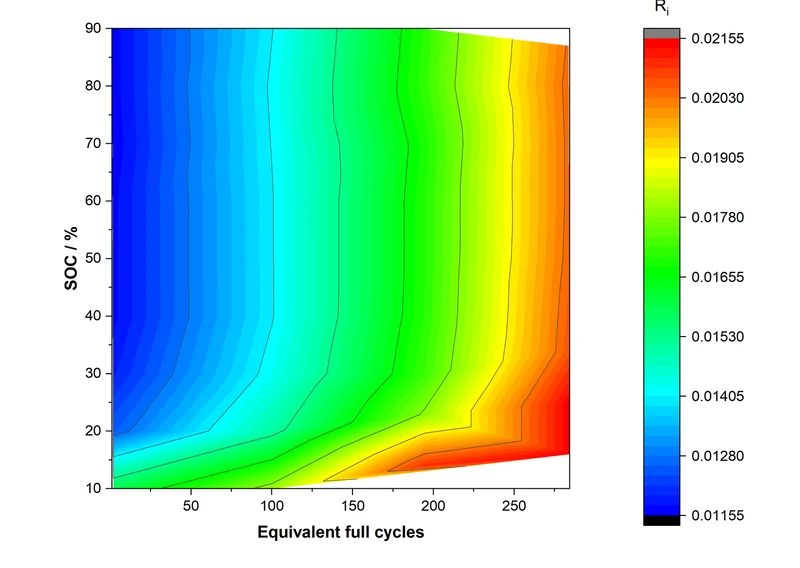
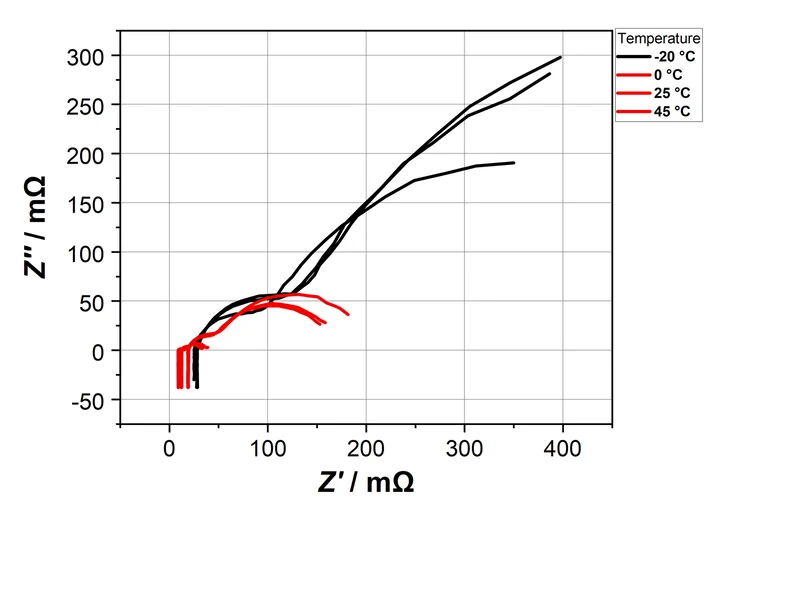
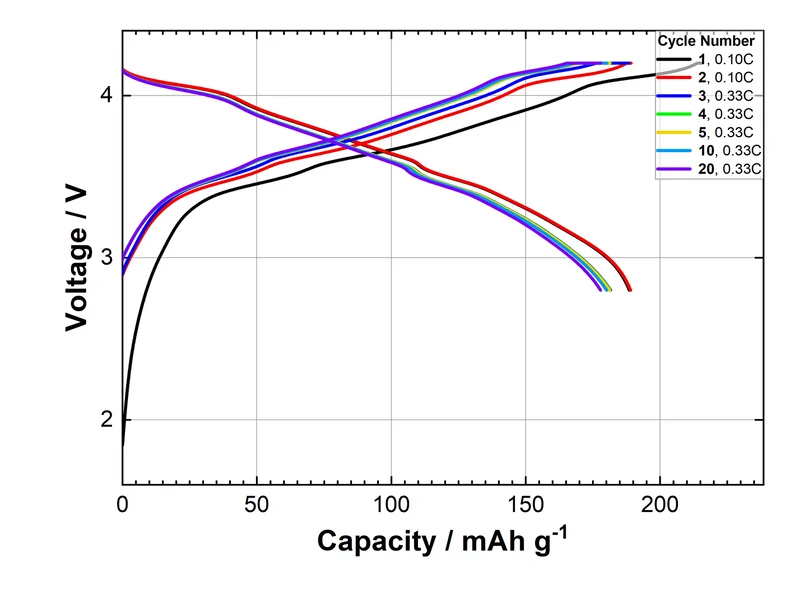
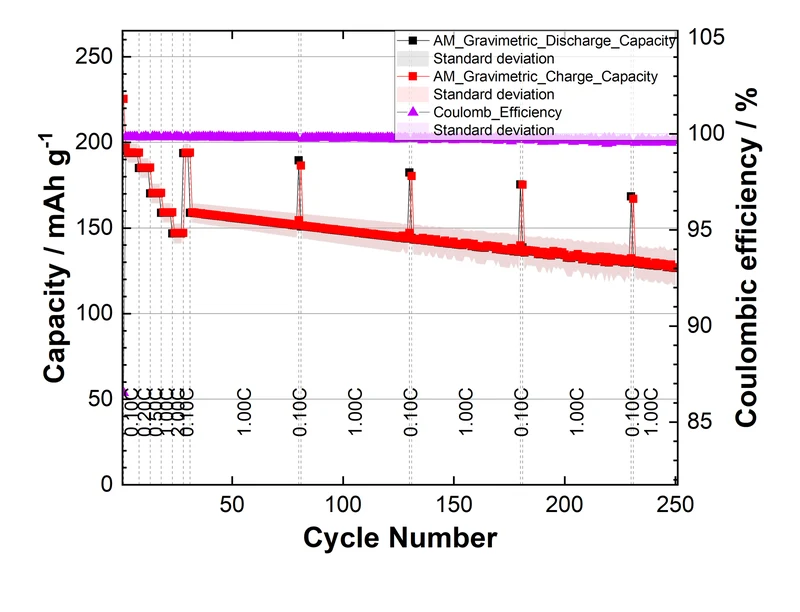
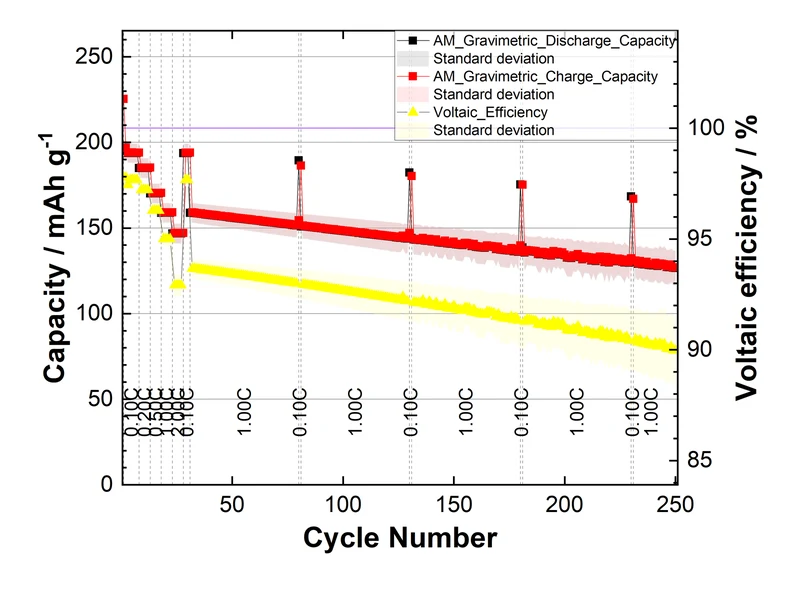
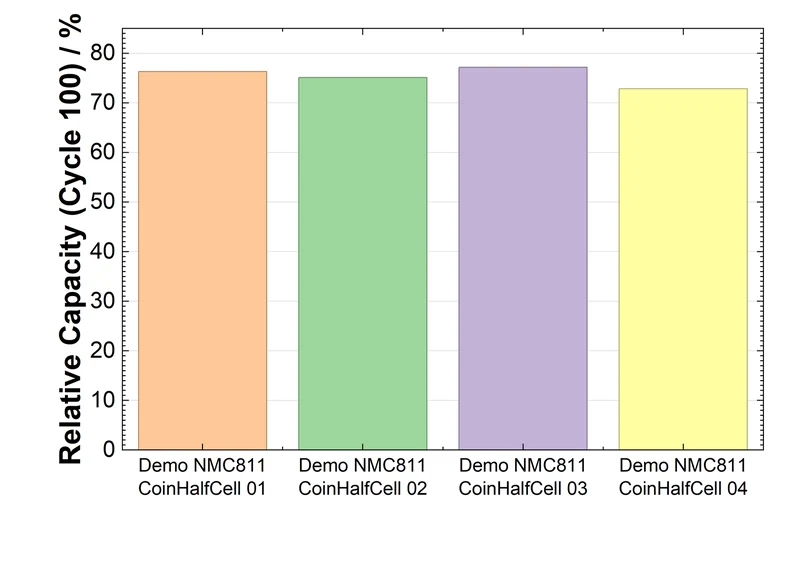
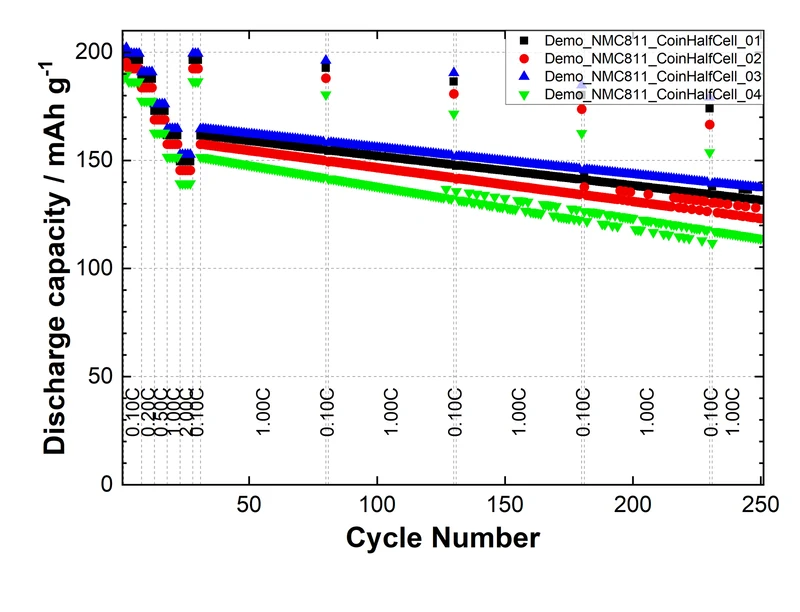
Vier Schritte, für jedes Gerät gleich
Importieren
Aus Ihrem Dateisystem, dem Netzwerk, einer Datenbank oder Batalyse Collect. Proprietäre Binärdateien werden direkt gelesen.
Beschreiben
Probenparameter einmal eingeben und für vergleichbare Zellen wiederverwenden.
Auswerten
Wählen Sie die benötigten Diagramme. Achsen, Einheiten und C-Raten werden automatisch beschriftet.
Vergleichen
Vergleichen Sie beliebig viele Tests mit Mittelwerten und Standardabweichung. Vergleiche aktualisieren sich, wenn sich ein Test ändert.
Das kann Data Analysis
Die Standardfragen, automatisch beantwortet
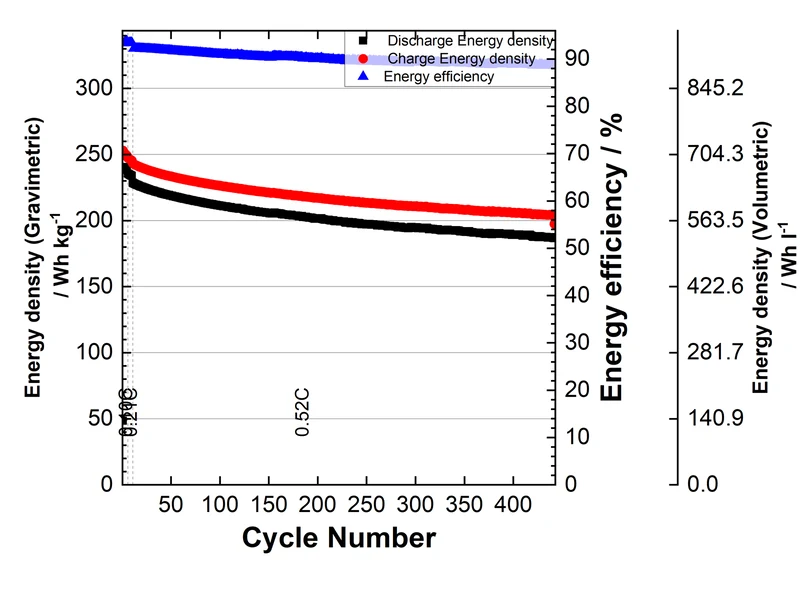
Kapazität, Effizienz und Widerstand über die Zyklenlebensdauer, ohne eine einzige Formel aufzustellen.
Lebensdauerkennzahlen
State of Health (SOH), DCIR, Polarisation, Effizienzen, irreversibler Verlust und äquivalente Vollzyklen.
Energie und Leistung
Energieeffizienz, kumulierte Energie und Ragone-Diagramm.
Kumulierter Durchsatz Neu 2026
Kumulierte Lade- und Entladeenergie mit einem Diagramm Durchsatz über Zyklus.
Spannungsrelaxation Neu 2026
dV/dt-Analyse von Pausenschritten mit biexponentiellem Fit für Ruhespannung und Zeitkonstanten.
Zusammenführen und fortsetzen
Unterbrochene Tests zu einer Auswertung zusammenführen; laufende Tests aktualisieren, ohne sie erneut auszuwerten.
Stapelauswertung
Viele Dateien nacheinander im Hintergrund verarbeiten, mit Fortschrittsanzeige und klaren Fehlermeldungen.
Mehr als Zyklisierung
Jede Methode bringt eigene Ergebnistabellen und Diagramme mit.
Puls / HPPC Neu 2026
Puls-Fit mit zwei RC-Gliedern für den ohmschen Widerstand und zwei RC-Paare, dazu Pulswiderstand und DCIR über Ladezustand, Zyklus und C-Rate. Pulse, die als mehrere Schritte aufgezeichnet wurden, werden als ein Puls erkannt.
GITT
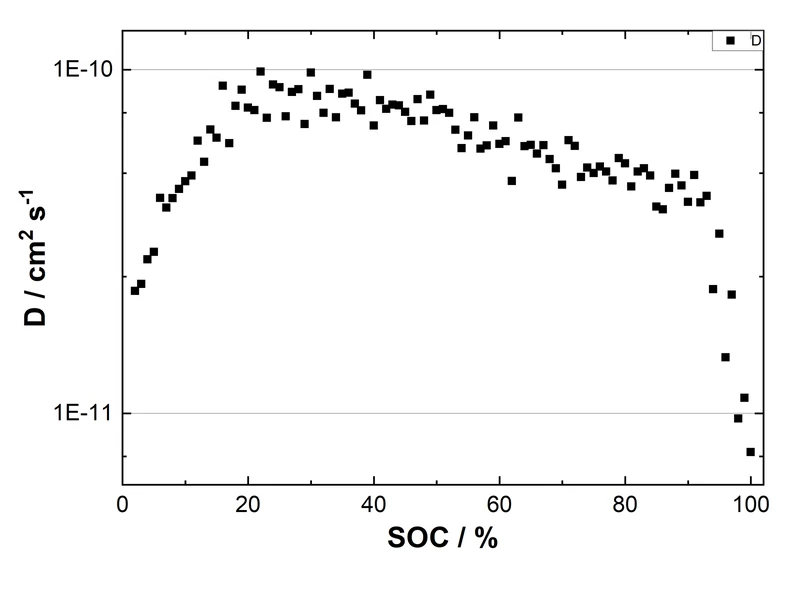
Diffusionskoeffizient aus Titrationspulsen, mit reproduzierbaren Fits.
Differentielle Analyse
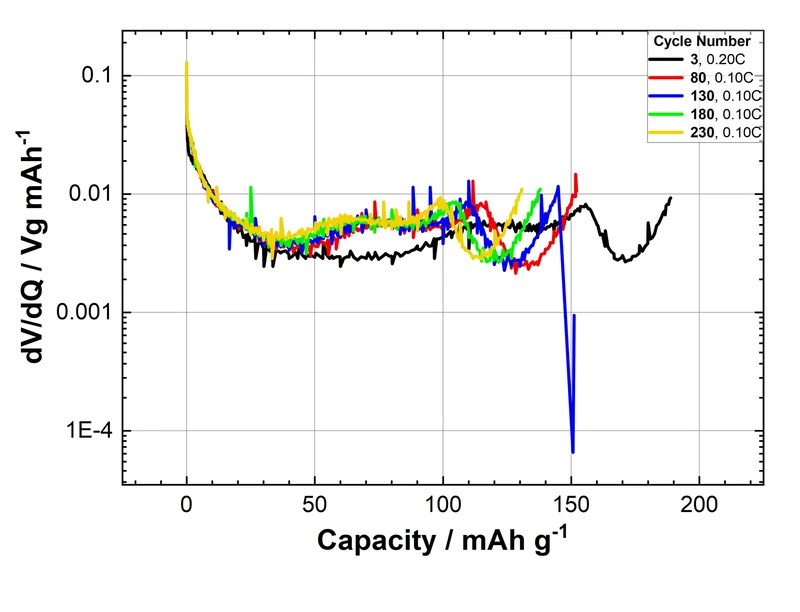
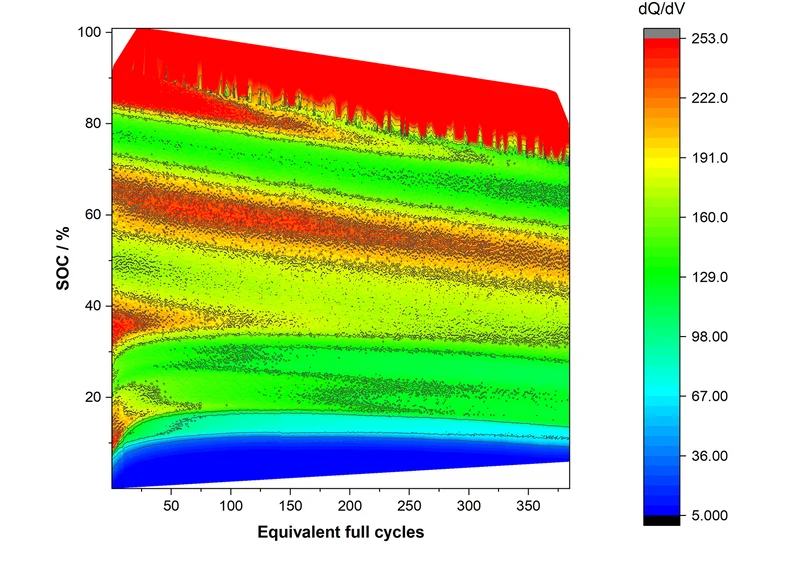
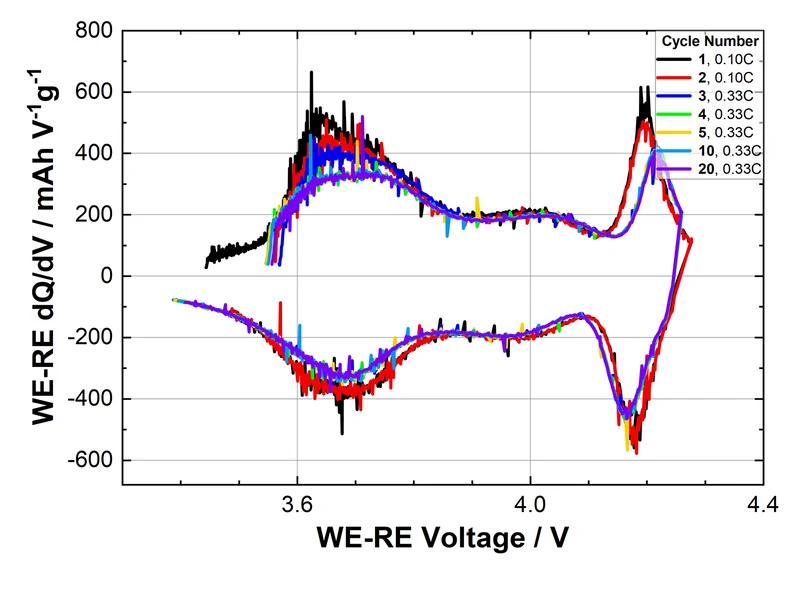
dQ/dV, dV/dQ (DVA) und dT/dV, mit Rauschfiltern und Heatmaps über Ladezustand und Zyklenlebensdauer.
Zyklovoltammetrie
CV-Auswertung inklusive flächenbezogener Stromdichte und zyklusweisem Vergleich.
EIS Neu 2026
Nyquist- und Bode-Diagramme sowie Trends des Ladungstransfers. In Collect gespeicherte EIS-Dateien werden von der EIS-Analyzer-Engine in Collect gefittet – Ersatzschaltbild, DRT und Kramers-Kronig – und in Origin dargestellt.
Referenzelektroden und In-operando
WE und CE gegen RE mit Ladeschlusspotentialen, Online-MS / DEMS, Dickenänderung.
Nicht nur Lithium-Ionen
Unabhängig von der Zellchemie: Li-Ion, Na-Ion, Lithium- und Natrium-Metall, Festkörper, Li-S, Zink-Luft und mehr.
Superkondensatoren
Kapazität, ESR, spezifische Energie und Leistung, maximale Leistung.
Batterie-Sicherheitstests
Thermal-Runaway- und Missbrauchstests mit Temperatur, Druck, Gasvolumen und thermischer Energie.
Brennstoffzellen und Elektrolyse
Ausgewertet in Data Analysis und verwaltet in Collect.
Redox-Flow-Batterien
Jede Chemie, jeder Stack, jede Elektrode und Membran.
Testserien vergleichen, nicht Einzeldateien
Ist das neue Material besser? Ist die Qualität des Lieferanten stabil? Der Vergleich gibt die Antwort.
Beliebig viele Tests
Über Geräte und Dateistrukturen hinweg, in einem Vergleich.
Statistik inklusive
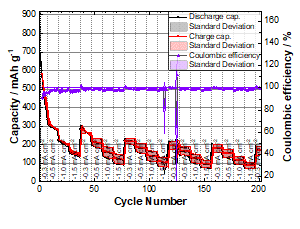
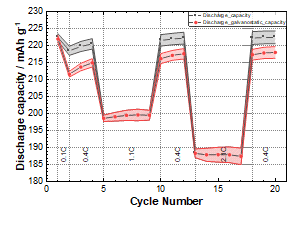
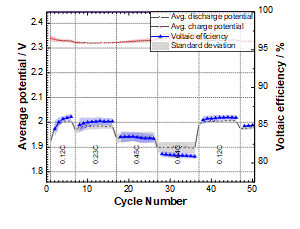
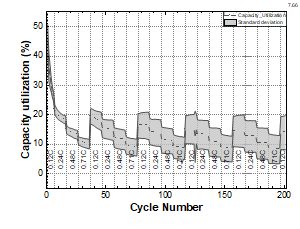
Mittelwerte, Standardabweichung und 79 Vergleichsdiagramme.
Immer aktuell
Wird ein Test aktualisiert oder neu ausgewertet, aktualisieren sich auch die darauf basierenden Vergleiche.
Probenparameter
Einmal eingegeben, gespeichert und wiederverwendet; Materialeigenschaften werden zu Vergleichskriterien.
Von Grund auf publikationsreif
Die Diagramme sind native Origin-Graphen, nichts muss von Hand nachgebaut werden.
Automatische Beschriftung
Achsen, Einheiten und C-Raten werden für Sie beschriftet, in einer oder zwei Sprachen gleichzeitig.
Ihr Hausstil
Schriften, Farben, Einheitenschreibweise, feste Achsen und Origin-Vorlagen, auf viele Diagramme gleichzeitig angewendet.
Kurven bearbeiten Neu 2026
Ein Dialog listet alle Kurven eines Diagramms: Darstellungsart, Farbe, Linienstärke, Symbole, Sichtbarkeit – oder alle gemeinsam bearbeiten.
Eigene Kurvenfarben Neu 2026
Eigene Farben für zyklusweise Kurven in Zyklus-, dQ/dV-, Bode-, CV- und Relaxationsdiagrammen.
Export
Bilddateien für Berichte und Veröffentlichungen; im Origin-Projekt bleibt jedes Diagramm bearbeitbar.
10 Beschriftungssprachen
Diagrammbeschriftungen auf Englisch, Deutsch, Französisch, Spanisch, Portugiesisch, Russisch, Japanisch, Chinesisch, Koreanisch und Türkisch; die Bedienoberfläche ist auf Englisch.
Auswertung für das ganze Team
In Kombination mit Collect muss niemand eine Auswertung von Hand starten.
Automatische Auswertung
Jede neue Datei in Collect wird auf einem eigenen Rechner ausgewertet.
Ergebnisse fließen zurück
Diagramme, Origin-Projekt und KPI-Tabelle werden in der Datenbank neben der Rohdatei gespeichert.
Anmeldung aus Data Analysis Neu 2026
Direkt bei Collect anmelden, mit Ihrem eigenen Konto; mehrere Collect-Server parallel.
Keine Konnektoren nötig
Collect liest proprietäre Formate selbst, daher ist keine Herstellersoftware auf dem Arbeitsplatzrechner nötig.
Neu in Data Analysis
Jahreslizenzen enthalten alle Updates. Die vollständige Liste steht im Änderungsprotokoll.
EIS-Auswertung über Collect
In Collect gespeicherte EIS-Dateien werden von der EIS-Analyzer-Engine in Collect gefittet – Ersatzschaltbild, DRT und Kramers-Kronig –, und Data Analysis zeichnet die Nyquist-, Bode- und Analysediagramme in Origin.
2026-04Kurven bearbeiten
Darstellungsart, Farben und Symbole aller Kurven in einem Dialog ändern.
2026-04Anmeldung bei Collect
Kein Kopieren von Tokens mehr: Data Analysis öffnet die Collect-Anmeldung und verbindet sich für Sie.
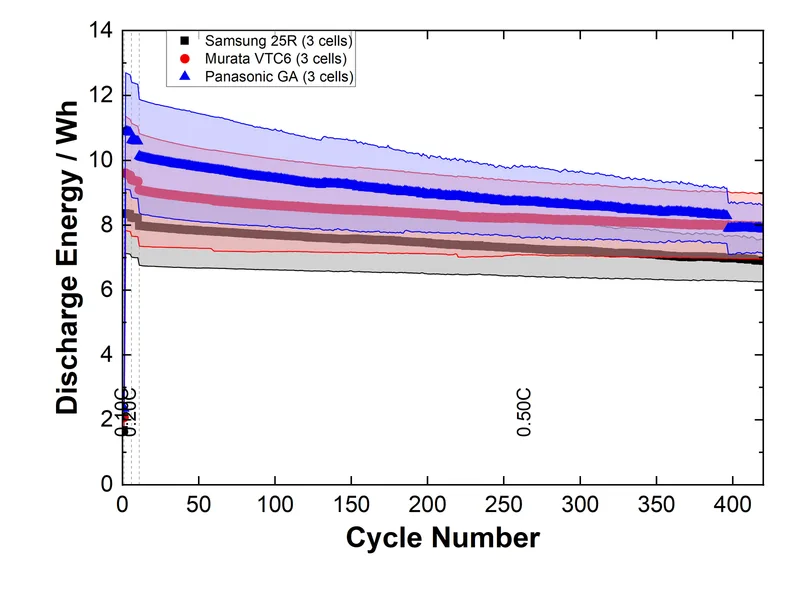
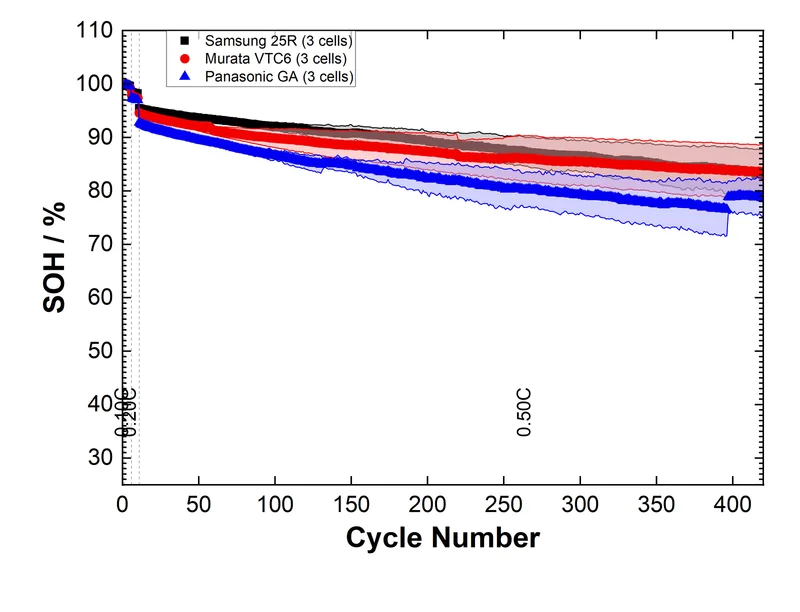
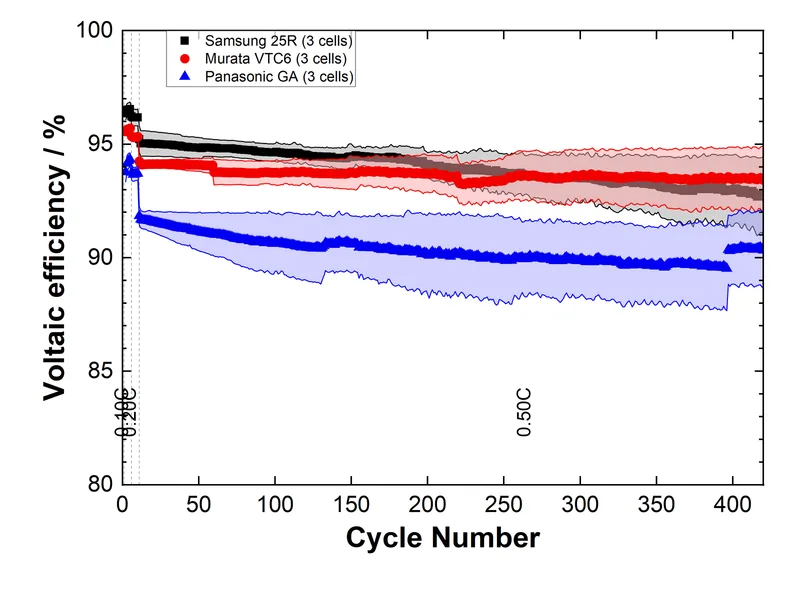
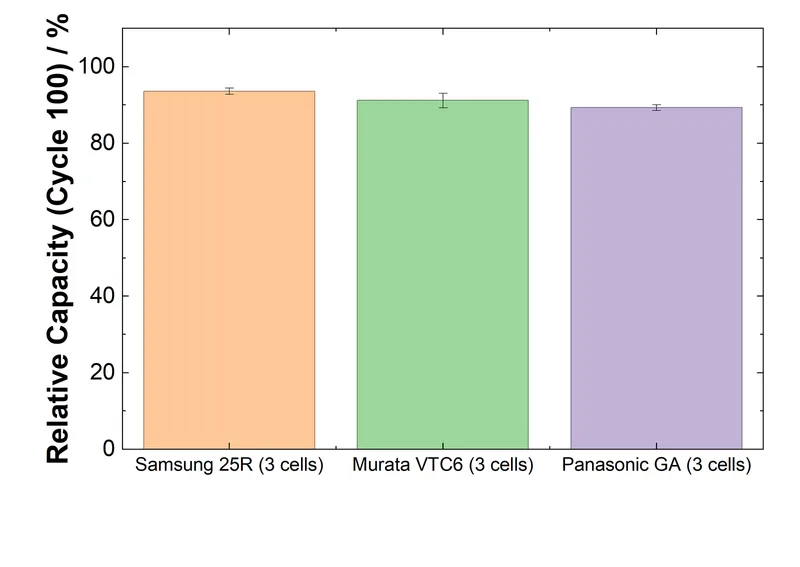
2026-03Unterschiede zwischen Testserien auf einen Blick
Tests auswählen, Vergleichsdiagramme wählen – die Statistik übernimmt Data Analysis.
- Mittelwerte und Standardabweichung pro Serie
- 79 Vergleichsdiagramme
- Verschiedene Geräte und Dateiformate in einem Vergleich
- Vergleiche aktualisieren sich automatisch
Liest die Dateien von über 30 Gerätemarken
Prüfgeräte von A–Z
Zelltester, Potentiostaten und EIS, Brennstoffzellen-Prüfstände, Datenlogger und Sensoren, nach Hersteller.
- Arbin
- Astrol
- AVL
- Basytec
- Battery Dynamics
- Bio-Logic
- Bitrode
- CH Instruments
- Digatron
- El-Cell
- Gamry
- Graphtec (Datenlogger)
- Hangke
- HORIBA FuelCon
- Ivium
- Keysight
- Landt / Lanhe
- LVDT-Dickensensoren
- Maccor
- Metrohm Autolab
- MicroE (Dicke)
- Neware
- Origalys
- PalmSens
- PEC
- Pfeiffer (Massenspektrometrie)
- Princeton Applied Research
- Scienlab
- Scribner
- Solartron
- THT (Kalorimeter)
- thyssenkrupp
- Zahner
Unterstützte Dateiformate
DA liest die Rohdateien, die Ihre Geräte schreiben, ohne Konvertierungsschritt.
Textexporte
.csv .txt .asc .datjedes Gerät.mptBioLogic EC-Lab.dtaGamry.idf .idsIvium.cor .zScribner MultiStat, ZPlot
Excel
.xls .xlsxjedes Gerät, alle Tabellenblätter
Binärdateien
.mpr .mppBioLogic.nda .ndaxNeware.cexLandt / Lanhe.noxMetrohm Autolab.pssessionPalmSensbinärMaccor.matMATLAB
Datenbanken
.resArbin.mdb .accdbMicrosoft AccessSQLZelltester-Datenbanken über ODBC
Neue Geräte und Dateistrukturen werden kostenlos ergänzt.
Ausgewertet auf Ihrem eigenen Rechner
Entwicklung und Support in Deutschland, deutsches Recht, direkter Kontakt zu den Entwicklern.
Auf Ihrem Rechner
Data Analysis läuft in Origin auf Ihrem Rechner. Messdaten und Ergebnisse bleiben dort oder auf Ihrem Collect-Server; Proxys, Windows-Authentifizierung und Offline-Lizenzen werden unterstützt.
Korrigierte Ergebnisse werden angekündigt
Ändert eine Version eine Berechnung, nennt das Änderungsprotokoll die Ergebnisse, die abweichen können.
Bereit für den Einkauf
EULA, AGB und Datenschutzerklärung können Sie vor dem Kauf prüfen; der Quellcode kann bei einem Treuhänder hinterlegt werden (Escrow).
Lizenzen
Auswertungspakete für beliebig viele Nutzer oder ein PC mit unbegrenzten Auswertungen. Jahreslizenzen enthalten Support und Updates.
| 500Auswertungen | 1.000Auswertungen | 2.000Auswertungen | 3.000Auswertungen | 10.000Auswertungen | 1 PCunbegrenzte Auswertungen | |
|---|---|---|---|---|---|---|
| Auswertungen pro LizenzjahrEine Auswertung = eine ausgewertete Testdatei; Vergleiche zählen ebenfalls | 500 | 1.000 | 2.000 | 3.000 | 10.000 | unbegrenzt |
| Nutzer und Rechner | unbegrenzt | unbegrenzt | unbegrenzt | unbegrenzt | unbegrenzt | 1 Rechner |
| Alle Methoden und DiagrammeSiehe unten | ||||||
| Lizenzen für den EIS AnalyzerEigenständige Anwendung mit eigener Lizenz; Auswertungen werden nicht gezählt | 1 PC | 1 PC | 2 PCs | 3 PCs | 3 PCs | 2 PCs |
Eine Datei erneut auswerten, einen laufenden Test fortsetzen und Ergebnisse aus Collect herunterladen ist kostenlos. Der EIS Analyzer ist eine eigenständige Anwendung mit eigener Lizenz; die oben genannten PC-Lizenzen sind enthalten. Mit Collect ist ein eigener Auswerte-PC mit unbegrenzten Auswertungen die bessere Wahl.
In jeder Lizenz enthalten, Services und Dauerlizenzen
In jeder Lizenz enthalten
- 183 fertige Diagramme in 11 Kategorien
- Zyklisierung und Lebensdauer, Puls / HPPC, GITT, EIS, differentielle Analyse
- Referenzelektroden und In-operando-Messungen
- Superkondensatoren, Sicherheitstests, Brennstoffzellen / Elektrolyse und Redox-Flow-Batterien
- Benchmark beliebig vieler Tests geräteübergreifend, mit 79 Vergleichsdiagrammen
- Unterbrochene Tests zusammenführen; laufende Tests aktualisieren
- Publikationsreife Diagramme mit eigenen Vorlagen; Export als Bilddateien
- 10 Sprachen, Diagramme in einer oder zwei Sprachen gleichzeitig
- Über 30 Marken von Zelltestern, Potentiostaten, Datenloggern und Massenspektrometern
- Proprietäre Binärdateien direkt gelesen, über Konnektoren, die sich selbst installieren
- Mit Collect: jede neue Datei automatisch ausgewertet
- PC-Lizenzen für den EIS Analyzer, eine eigenständige Anwendung für die Impedanzanalyse
Services und Lizenzoptionen
Reduzierte Preise für Forschungseinrichtungen, Hochschulen, Start-ups und KMU, für mehrere Module und mehrjährige Lizenzen. Der Lizenzrechner liefert eine Schätzung, den Preis nennt Ihr Angebot.
Data Analysis herunterladen
Läuft in OriginLab Origin 2022b oder neuer; eine Standard-Origin-Lizenz genügt, OriginPro ist nicht erforderlich. Ziehen Sie das Installationsprogramm in ein geöffnetes Origin-Fenster und fordern Sie dann in der App eine kostenlose Demo-Lizenz an.
Frühere Versionen: Batalyse-2026-05d.opx · Batalyse-2026-05.zip
Versionshistorie von Data Analysis
Die Versionshinweise sind auf Englisch.
2026-06 (2026-10-23)
- Temperatures in the cycle summary
- Average, minimum and maximum per charge, discharge and step, for each channel T1–T4
- Deviation from the set temperature, and self-heating where an ambient sensor is defined
- Step-end (condensed) exports, for example from Basytec, get a cycle summary with capacities, Coulomb efficiency and C-rates
- Pulse (HPPC) tests
- A pulse table, one row per pulse, is uploaded to Collect
- Pulses are taken from the linked Neware test plan, including pulses cut short by the voltage limit
- Pulse DCIR is positive for charge pulses too
- Corrected results
- Step energies are the integral of voltage over charge: CC-CV, CV and constant-power charge energies were up to 48 % too low
- Average voltages are weighted by charge; energy efficiency, energy densities and SOH (energy) follow
- CorrWare .cor files: the cell area no longer scales the current
- Files analysed as a single step get their step and cycle capacity and time
- Faster: dQ/dV heatmaps of a 100,000-row file in 0.2 s instead of 4.7 s; graphs 4.8 and 4.9 of very large files in seconds instead of up to 43 minutes; thickness and reference-electrode data merged in minutes instead of half an hour
- Batalyse Collect
- Collect shows which Data Analysis version produced a result
- Uploads to a busy server wait instead of losing files
- Failed jobs give one clear reason, without local folder paths
- Graphs are exported even for specimens without graph-export settings
- KIT, FuelCon and Zahner jobs no longer fail with "System not recognized"
- Graphs and comparisons
- Many legend, axis and label corrections; Bode plots match the other graphs
- A failing graph no longer drops the graphs after it
- EIS draws every spectrum, also beyond eight
- Updating a comparison's parameters no longer damages its averages sheets; damaged ones are repaired
- The Ragone graph pages are renamed "… (AM)" and "… (Cell)"
- Fixes
- Data Analysis starts again on Origin 2022b
- No more hangs or crashes on Origin 2026b during the step analysis
- Inch and quotation marks in a file header no longer stop the import
- New toolbar icons, with a set for Origin's dark mode
2026-05 (updated 2026-09-15)
- Pulse (HPPC) tests
- Pulses recorded as several consecutive program steps are recognised as one pulse, so pulse DCIR, pulse sheet, fitting and graphs are filled again
- Pulse.1 and Pulse.2 show all points of interest
- The most recent pulse cycle is no longer missing
- Cyclic voltammetry
- CV files with a time column are analysed as CV, including Continue Import
- Cycle detection works for µA-range measurements
- Custom curve colours for per-cycle curves across cycle, dQ/dV, EIS Bode, CV, relaxation and scatter graphs
- Import & databases
- Landt/Lanhe .cex files are analysed completely
- Landt Excel exports with lost decimal points are repaired automatically
- New option to ignore specimen metadata stored in BioLogic, Bitrode and custom databases
- Parameters dialog
- Component-specific Batch/Specimen ID labels
- Read-only analysis of view-only specimens
- No more invented values such as 2700 % active material
- Background jobs & uploads
- Progress stays visible for every long step
- Very large graph exports are no longer stopped as "frozen"
- Uploads to slow Collect servers resume instead of restarting
- Failed jobs are always reported as failed with a reason
- Fixes
- Reference-electrode columns matched by name
- Mass spectrometry values per cycle filled again
- BioLogic files with comma decimals from Collect no longer give inflated capacities
2026-04 (updated 2026-07-17)
- Integrated EIS Analyzer: EIS files from Batalyse Collect are now analysed with the full Batalyse EIS Analyzer
- Equivalent-circuit fit, DRT and Kramers-Kronig validation
- Nyquist, Bode and analysis plots are created in Origin, exported as images and uploaded back to Collect
- A combined Origin project (.opju) export of an EIS analysis, including graph customization, can be requested from Collect
- Supported on Origin 2022b - 2024b in addition to Origin 2025/2026
- New "Edit graph curves" dialog: a new toolbar button lists every curve of any graph in your project and lets you change the plot type (line, scatter, line + symbol), line colour, width and style, symbol colour, size and shape, and show or hide individual curves. A bulk-edit row applies a setting to all curves at once and the dialog stays open after Apply.
- New voltage relaxation (dV/dt) analysis of rest steps: per-rest dV/dt and rest time, fast/slow segmentation and a bi-exponential fit of the rest voltage giving the open-circuit voltage, the fast and slow amplitudes and time constants and the fit quality. Two new graphs show the relaxation curves (one curve per rest, coloured and labelled by SOC) and the time constants versus SOC and cycle.
- Cumulative energy throughput: new cumulative charge and discharge energy columns and a new "Throughput vs. cycle" graph combining cumulative capacity and cumulative energy.
- Further new graphs:
- Cumulative discharge endpoint capacity slippage plot (1.31)
- CV comparison graphs - areal current density vs. voltage and voltage vs. current density, split into one curve per cycle
- Graph 4.5 (voltage vs. test capacity) is now plotted per selected cycle
- Median and median + moving-average noise filters with configurable window size for the differential curves (dQ/dV, dT/dV) and the relaxation curve.
- Date and time of each cycle start is now available as a Date_Time column in the per-cycle summary export, for KPI exports and partner data exchange.
- Gamry EXPLAIN (.DTA) files are supported, including the short OCP / corrosion-potential exports that were previously rejected.
- Files parsed by Collect (BioLogic .mpr, Neware, Maccor, Ivium, Metrohm, Lanhe/Batalyse .cex) are recognised with their Collect column names.
- Faster installation, updates and analysis: the program code is shipped in a few large bundles instead of dozens of individual files, and the heaviest calculation loops were optimised for very large files.
- Analysis of large merged files no longer hangs - the DCIR delay search and the rest-step fits were reworked (worst case dropped from 60 s to under a second per fit), and the rest fit now shows a progress bar and can be cancelled.
- Works behind corporate proxies: the system proxy configuration (including automatic configuration scripts) and Windows integrated authentication are used automatically, and connections through TLS-inspecting proxies no longer fail.
- 24-hour grace period for the licence check - a temporary connection problem to the licence server no longer reports your licence as expired.
- Bug reports with screenshots and attachments: paste a screenshot directly into the bug-report dialog, attach files, and save the report as a ZIP file if sending fails.
- Corrected results. Please note that results recalculated with this version can differ from earlier ones:
- The average step voltage is time-weighted again; average power and line energy follow from the corrected voltage, and the average current now uses the same method on all Origin versions
- Corrected specific capacity denominators (coating, electrolyte and separator) and stack volumetric capacity
- Irreversible loss is now calculated for tests that start with a charge step
- GITT diffusivity - fit window, physical constants, unit conversion and per-pulse current are handled correctly, and repeated runs give identical results
- Cumulative energy is now deterministic, and Line_Time uses the step time reported by the device
- Further fixes: Continue Import for Basytec MySQL databases, Lanhe Excel files that could hang Origin, Excel import without the separate Excel Connector, start and end date/time supplied by Collect, C-rate labels on time-axis graphs, weights entered in g or kg, EIS impedance columns from Collect, and parallel analysis of several Collect files without a Collect Monitor login.
- A systematic correctness and stability review of the whole analysis removed a large number of latent faults in the cycle, step, pulse, EIS, comparison and graph code - a frequent cause of aborted analyses.
- Please note: this version of Data Analysis requires Batalyse Collect version 23.07.2026 or newer.
Ältere Versionen
- Sign in to Batalyse Collect directly from Data Analysis. Instead of creating an access token in Collect's admin area and pasting it in, Data Analysis opens the Collect login page and establishes the connection for you. Expired or invalid access is detected and the login re-opens automatically.
- Personal access instead of admin access. Each user's connection is stored under their own name, and a dedicated Monitor User setting lets the Collect Monitor run under a normal user account.
- Several Collect servers side by side:
- Access is stored per server, so switching between servers that share a user name no longer overwrites each other
- The server address field is now a dropdown with your previously used addresses
- The active server is shown in the dialog titles
- You can log out directly from the batch monitor
- Much more informative error reporting in the batch monitor and the Collect Monitor: the error message, the processing step where it happened, a timestamp and the job type are shown in the Errors column. Error rows can be removed, and stalled or silently crashed background jobs are detected instead of hanging at a fixed percentage.
- Reference-electrode end-of-charge potential: new WE-RE and CE-RE end-of-charge columns with the matching formulas and a new graph, plus a combined WE-CE / WE-RE / CE-RE electrode view.
- Improved BioLogic BCS support with better extraction of the values from the file header.
- Adjustable minimum step current for step detection, for cyclers whose zero-current steps carry a small residual current.
- Uploads and downloads no longer depend on Python. All transfers to and from Batalyse Collect now use a built-in transfer component, which makes transfers more robust on restricted machines.
- Faster comparisons and graph export - data for nested tests is only downloaded when a selected graph actually needs it.
- Units are transferred to Collect as proper characters (superscripts, µ, Ohm), so uploaded summary tables read correctly.
- Better detection of "Info" sheets in Excel-based exports, and step names now include pause steps.
- Exported graph images carry the plot type in the file name.
- Fixes:
- Row capacity is integrated with midpoint interpolation of the current, and discharge energy keeps its sign
- Combined charge + discharge comparison graphs showed duplicated legend entries and wrong colours and line styles
- Continue Import silently imported nothing in some cases and produced empty error reports; capacity and all dependent formula columns are now recalculated for the appended rows
- Access database import, and header lines with an unusual number of columns
- Background comparisons that stayed at 0 % or reported no error, and comparisons of comparisons that could not find their underlying tests
- Collect uploads with numeric or boolean metadata values, duplicate column headers and over-long file names
- Fixed the line-end average voltage, which was calculated incorrectly on Origin 2025 and older.
- Several fixes for direct database imports.
- Licence retrieval retries automatically instead of failing on a single unsuccessful attempt.
- Better EIS comparison plots for tests with only a single cycle.
- Fixed that parameters from one file could overwrite another file's parameters when several files were configured in the same "multiple files" session.
- Fixed the time column, which was not fully calculated in certain cases on older Origin versions.
- A confusing cycle-selection error message no longer appears when the selection cannot be matched.
- Full reference-electrode analysis:
- New WE-RE and CE-RE result columns (average potential, polarization and more)
- DCIR for reference electrodes and new step polarization graphs
- Reference-electrode graphs are plotted whenever the corresponding standard graph is selected
- Counter-electrode potential offset: an offset can be entered in the Parameters dialog and is applied to all single-test graphs, with axis scales rounded accordingly.
- SOH and further new graphs versus equivalent full cycles.
- BioLogic BCS files are supported.
- Already-analysed tests can be merged - the previous analysis is stripped automatically, so a merge of merges is possible, locally or through Batalyse Collect. A "delete original data" option was added when merging into existing results.
- Uploads to Batalyse Collect are resumable and retry automatically, so large uploads survive a dropped connection.
- Graph labels are fully translated into 10 languages (English, German, French, Spanish, Portuguese, Russian, Korean, Japanese, Chinese, Turkish) - axis titles, DCIR, SOC/SOH/OCV, electrode designations, efficiency, capacity slippage and differential-analysis labels.
- Modernised dialogs with a consistent look, and the exact version (including subversion) is now shown in the dialogs.
- Assign Columns moved into the Parameters dialog, so column mapping is done together with the rest of the test setup.
- Faster analysis through a series of performance improvements, and the file selection dialog now shows all relevant file types.
- Fixes:
- "Continue Import" - importing new data into an already-analysed workbook works again
- EIS - comparison graphs no longer error out, legends are correct when multiple EIS data sets are shown, and missing cycle ends are detected
- Merging files from Collect with differing columns, and duplicate upload errors in Collect
- Safety-test graphs and the safety-test KPI table upload
- The pulse comparison summary table and its graphs
- Compatibility with Origin 2026 - incorrect test-SOC results and a calculation error in certain graphs
- Reference electrodes and extra measurement channels from separate files: additional columns recorded in a second file (for example a reference-electrode or sensor file) can now be linked to a test and analysed together with it.
- Direct import of Maccor and Neware binary files through dedicated connectors, and Arbin Access databases moved to the normal Import button instead of the separate database import.
- Connectors install themselves automatically (CSV, XLSX and others), and are fetched from Batalyse if the OriginLab download fails.
- Circle fit for EIS: the semicircle of the Nyquist plot is fitted automatically and its parameters are written to the results.
- New graphs: CC-CV comparison, CC-CV charge + discharge comparison, additional dQ/dV diagrams including dQ/dV vs. capacity separated into charge and discharge (single test and comparison), and new BST/BTS graphs.
- "Equivalent full cycle" column added to the step data.
- Dark mode for all dialogs, following the Windows system setting.
- Merging of predefined groups from Batalyse Collect, so a group defined in Collect can be analysed as one merged test.
- More accurate device and step-type recognition: better detection of Neware and Maccor files, BioLogic step recognition when the "MD" column is unusable, more reliable identification when current and voltage barely change, and case-insensitive column matching.
- More date and time formats are understood, and files with only two columns can now be imported.
- The licence dialog was reworked, including offline licences.
- Proxy settings are set to "system" automatically when they were previously "direct", so connections work on managed company networks.
- Fixes:
- Uploads to Collect failed for file IDs above 10 million
- Step and test SOC were calculated incorrectly when the negative electrode was selected
- dT/dV columns and the corresponding graphs were wrong
- Relative capacity was wrong when "Full capacity cycle" was set to 0
- The Potential-Current-Temperature graph and the current-density right-hand axis
- Mean values were wrong when only a single column was selected
- Data Analysis failed to compile on Origin versions older than 2025
- EIS data from Arbin Excel exports is now recognised and analysed.
- Linking measurement files now happens in the Parameters dialog instead of a separate step, so everything about a test is configured in one place.
- Better recognition of file structures, so more exports are read correctly on the first attempt.
- Faster downloads from Batalyse Collect, with more forgiving timeouts on slow connections, improved Collect sign-in handling and a tidier connection dialog.
- The Basic Parameters section of the Parameters dialog was reworked.
- Fixes:
- EIS comparisons of more than 8 tests no longer fail
- "Set all" in the Parameters dialog now applies the values reliably to every selected file
- Landt files import correctly again, and LVDT / data-logger files import more reliably
- The default minimum-difference setting for dQ/dV was corrected
- Data Analysis now automatically installs the proprietary file format connectors for .mpr and .cex files and a python package. You no longer need to manually install or update these connectors when installing or updating Data Analysis. Batalyse plans to add more connectors in collaboration with OriginLab in the coming months.

- Improved and expanded specimen dialog.

- Code Optimization – Automated pulse/HPPC fits - faster calculations, especially when handling a large number of measurement points during the pulse.
- New comparison graph: Discharge and charge capacity for each selected test over the cycle number vs Coulom Efficiency / Voltaic Efficiency / Energy Efficiency.

- Polarization graphs available for single tests now also added for comparisons.

- Improved support for supercaps: New result graphs, labelling options and expanded calculation table.

- The axes of EIS comparison graphs are now uniformly scaled, and the object manager displays the test name.

- New CV graphs added:

- We have improved the tooltips in the specimen dialog to be less intrusive. Now, only one tooltip is displayed at a time, preventing multiple active tooltips from blocking your view.

| Bug fixes: - Fixed a bug where specimen parameters from the file header of Biologic/Neware files were not correctly applied during graph calculations. - Resolved issues causing problems when merging Neware files. - Hangke formation tester files didn't show the Excel sheet names in the legend. |
- Perform automated pulse / hppc fits and receive insights on electrolyte, concentration and charge transfer resistance. More information: M. Daowd et al., Battery Models Parameter Estimation based on Matlab/Simulink, International Review of Electrical Engineering, 7(4), 4915-4924.

- New: Analyze Battery Safety Tests! Data Analysis now supports data loggers with multiple channels to record voltage, pressure, and temperature at various cell or module positions. Easily determine onset temperature, emitted gas volume, and maximum temperature. If you conduct safety tests, feel free to contact us!

- DCIR - new single and comparison graphs

- Constant Current - Constant Voltage (CC-CV): Gain deeper insights into the capacity distribution at each stage

- Enhanced Split Graph Feature: Easily extract individual curves from a graph into separate graph objects. This feature now supports a wider range of graph types.

- Graphs with an x-axis based on cycle ranges can now be duplicated or multiplied, each with a defined cycle range to focus on specific test sections.

- EIS graphs can now be selected via the Graph Control tab, and new EIS graphs have been added.

- Improved support for various test devices e.g. Maccor, Neware, Gamry, Solartron,...

- Graph calculation formulas are now displayed both in Graph Control - Graph selection and above each created graph

- New information dialog

- WE coating thickness - enry added/linked to Basic Parameters section

- Comparison graphs: new error display style added. With "None" only the standard deviation is plotted.

- Curve colors can be edited more easily now (only from Origin2024b)

- New Graph Control option: Show/hide vertical reference lines

- New comparison result graph added: Discharge capacity, CE vs. cycle comparison

- Improves support for various test devices
- Improved merge feature
- New graph customization option #1: Select individual color for Voltaic and Energy efficiency and adjust efficiency axis range(s) and increment(s)

- New graph customization option #2: (De)Acitvate graph gridlines

- Coin cells (CR1616 and CR2032) added to the Cell format section

- File name is now displayed in Collect monitor

- Password entry in Data Analysis to connect to Collect is by default hidden

- Improvements and bug fixes with the Data Analysis continue import function in combination with our Collect database software.
- Improvements for EIS analysis:
- x/y axis now have the same scaling
- Curves have different color
- Resistance is now normalized to electrode area if added in dialog
- Improvements for EIS analysis:
- Reference electrodes
- New reference electrode result dQ/dV graphs
- WE-RE voltage at x and y axis
- CE-RE voltage at x and y axis
- New reference electrode result dQ/dV graphs
- You can now also directly assign your test file columns when working with Biologic mpr files. Please update your mpr connector to the latest version.
- Reference electrodes

- New support for Galvanostatic intermittent titration technique (GITT) tests

- Added support for Battery Dynamics test devices
- Improved support for Neware, Astrol, Ivium, Maccor and Nanocycler test devices
- Data Analysis v2024-04 uses a Python package to accelerate the upload of results to Batalyse Collect database. This is only relevant for you if you use both Data Analysis and Collect. Please accept the installation of the Python package in that case.

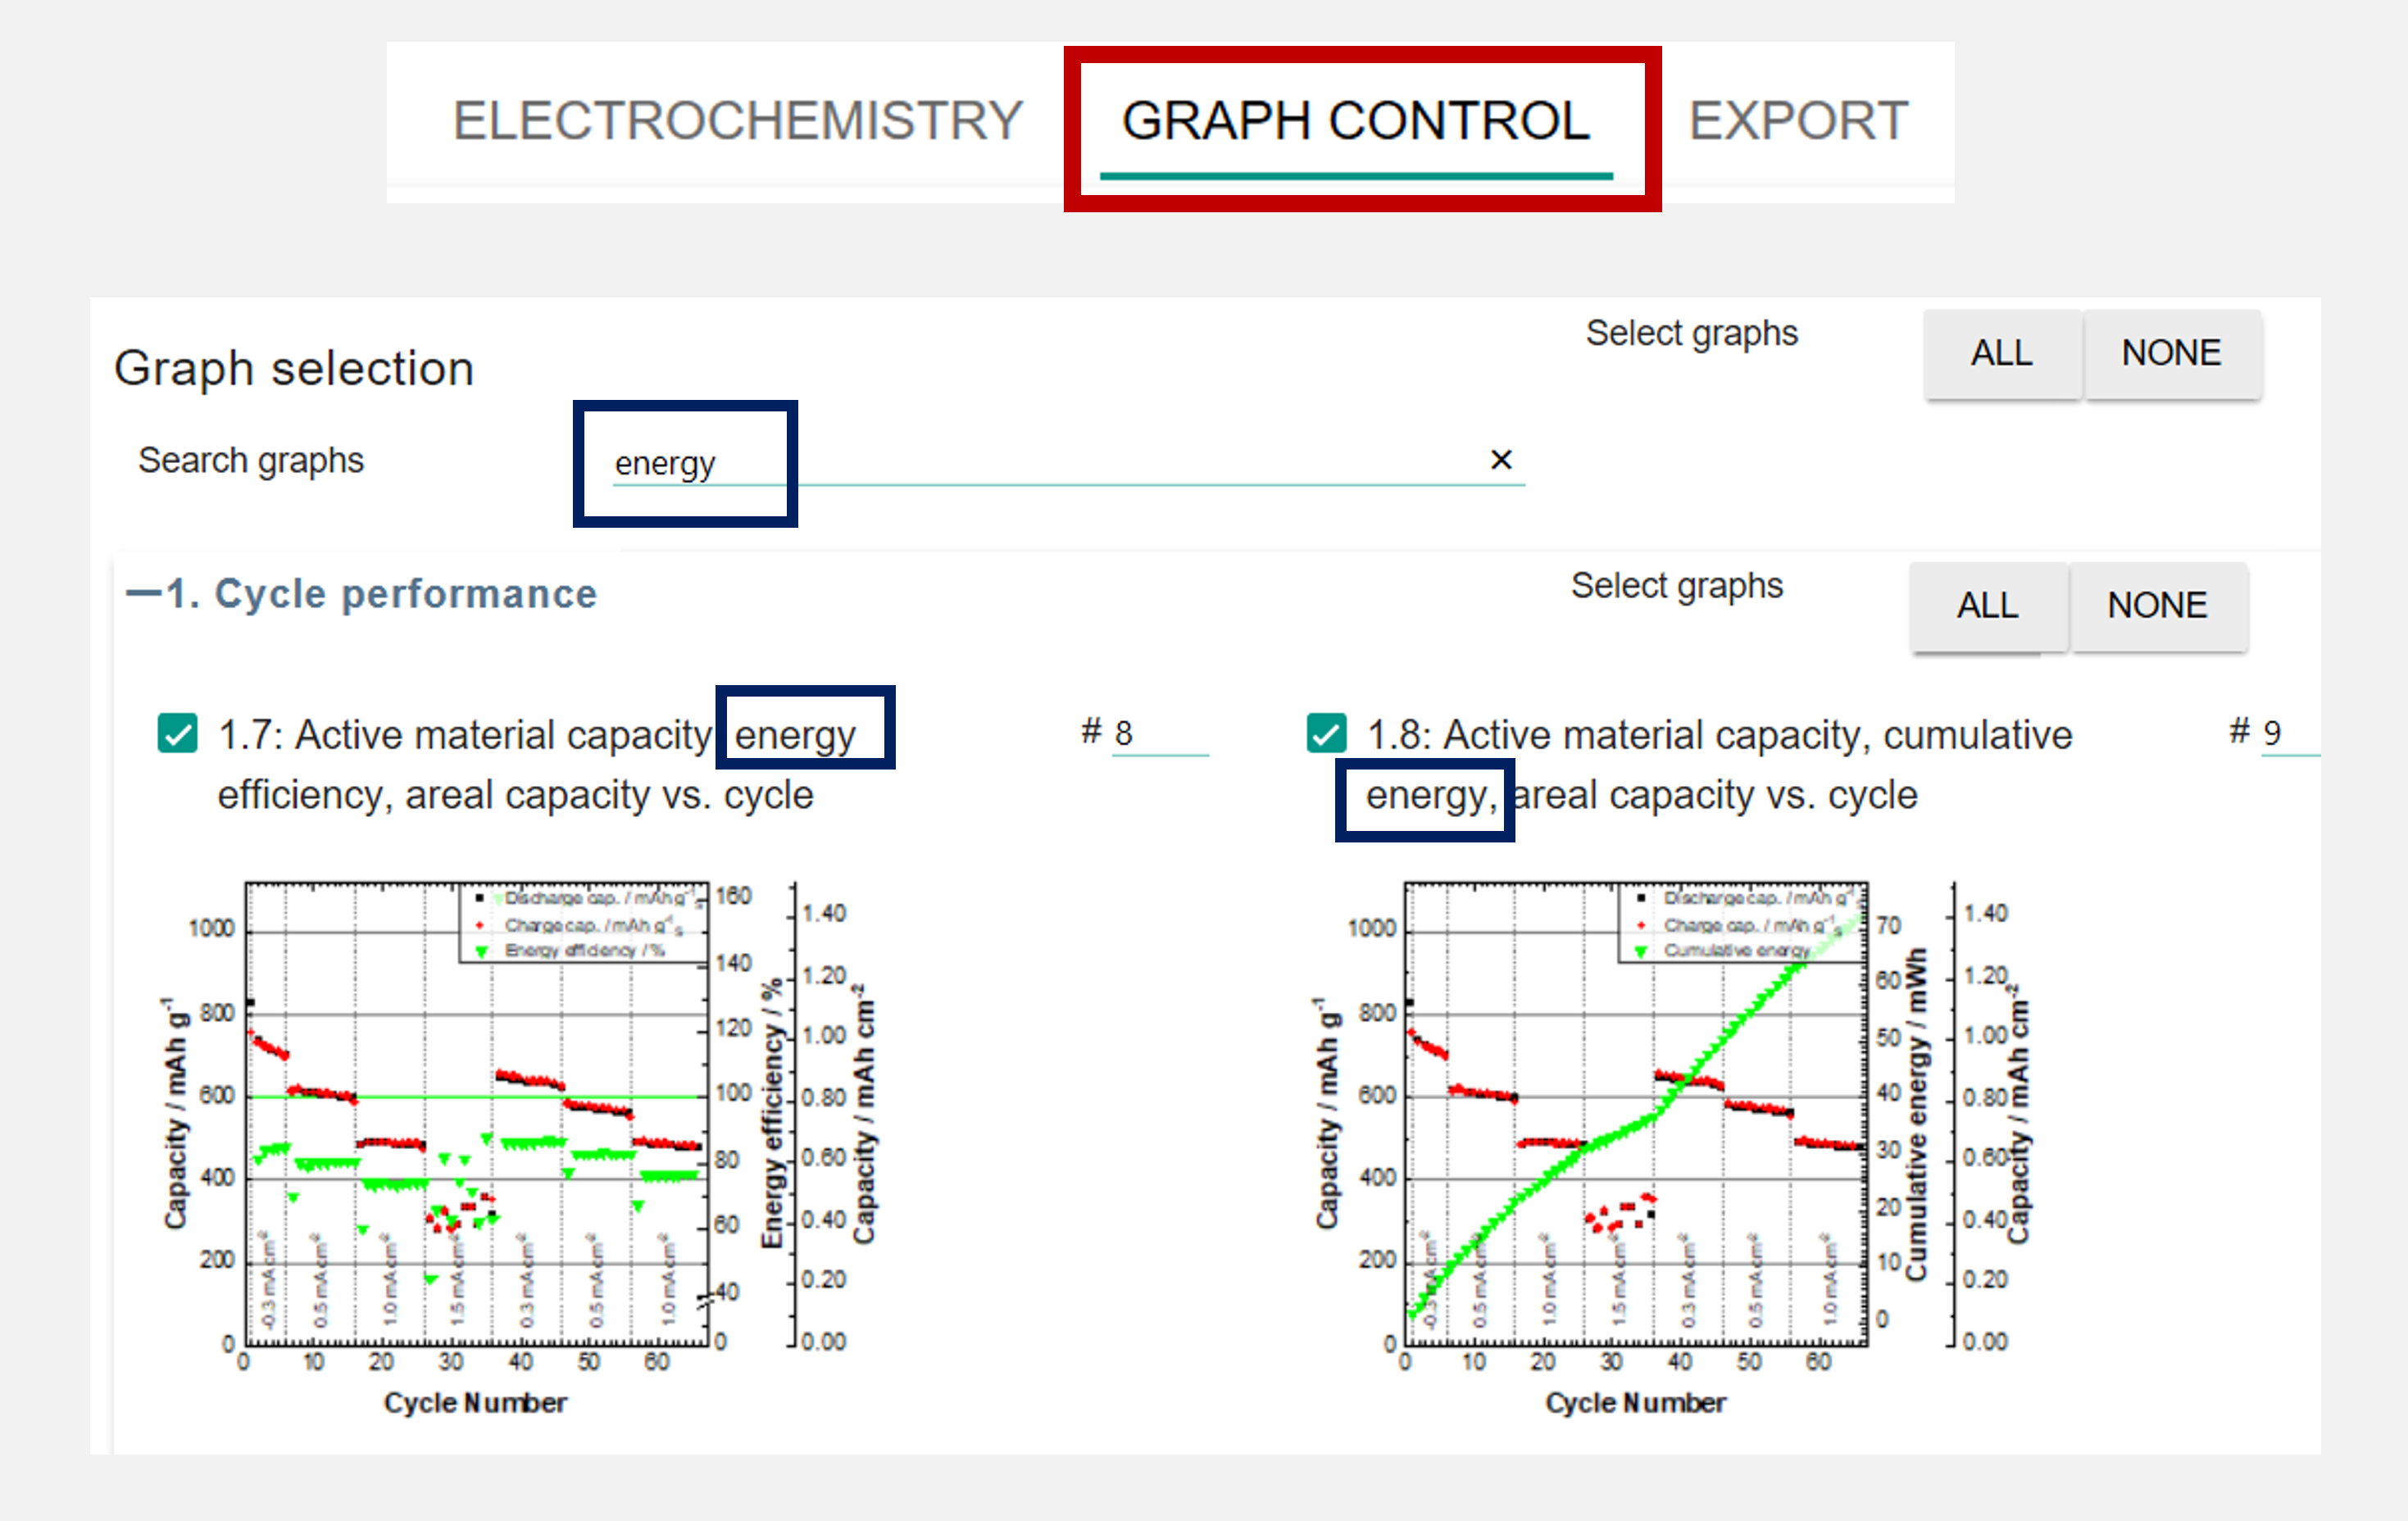
- Search and filter your result graphs
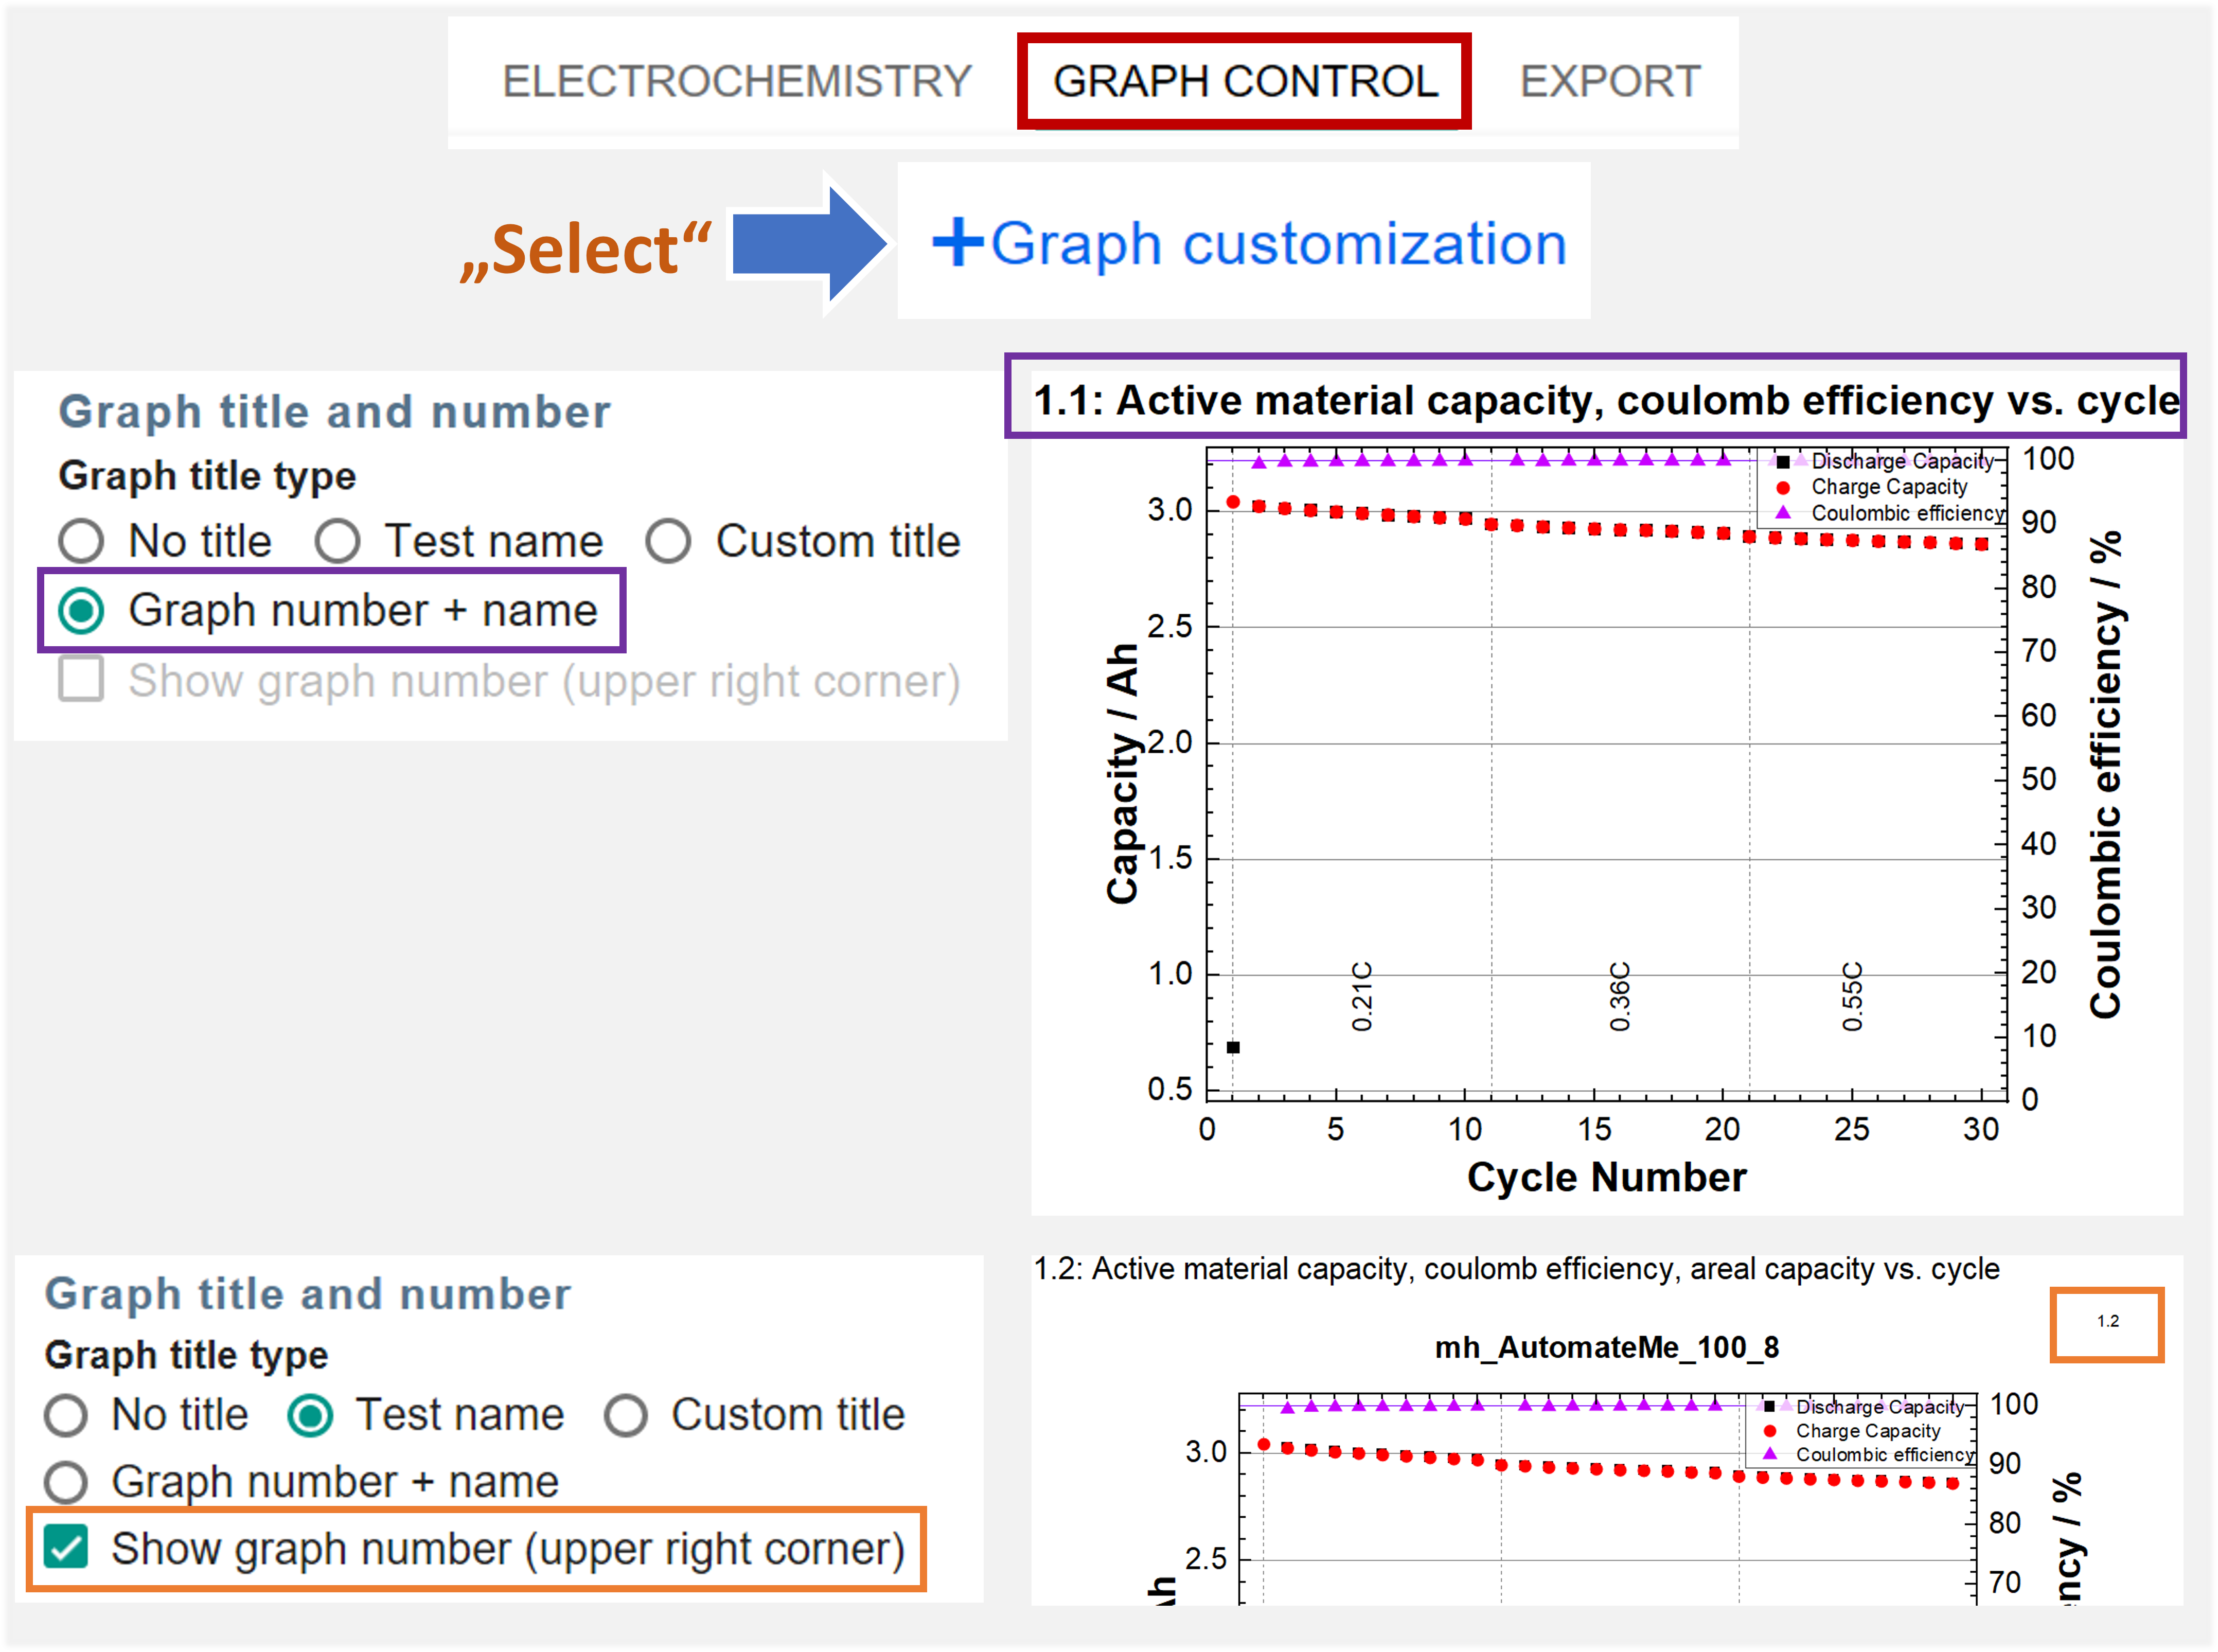
- Identify your result graphs easier and faster by the graph number
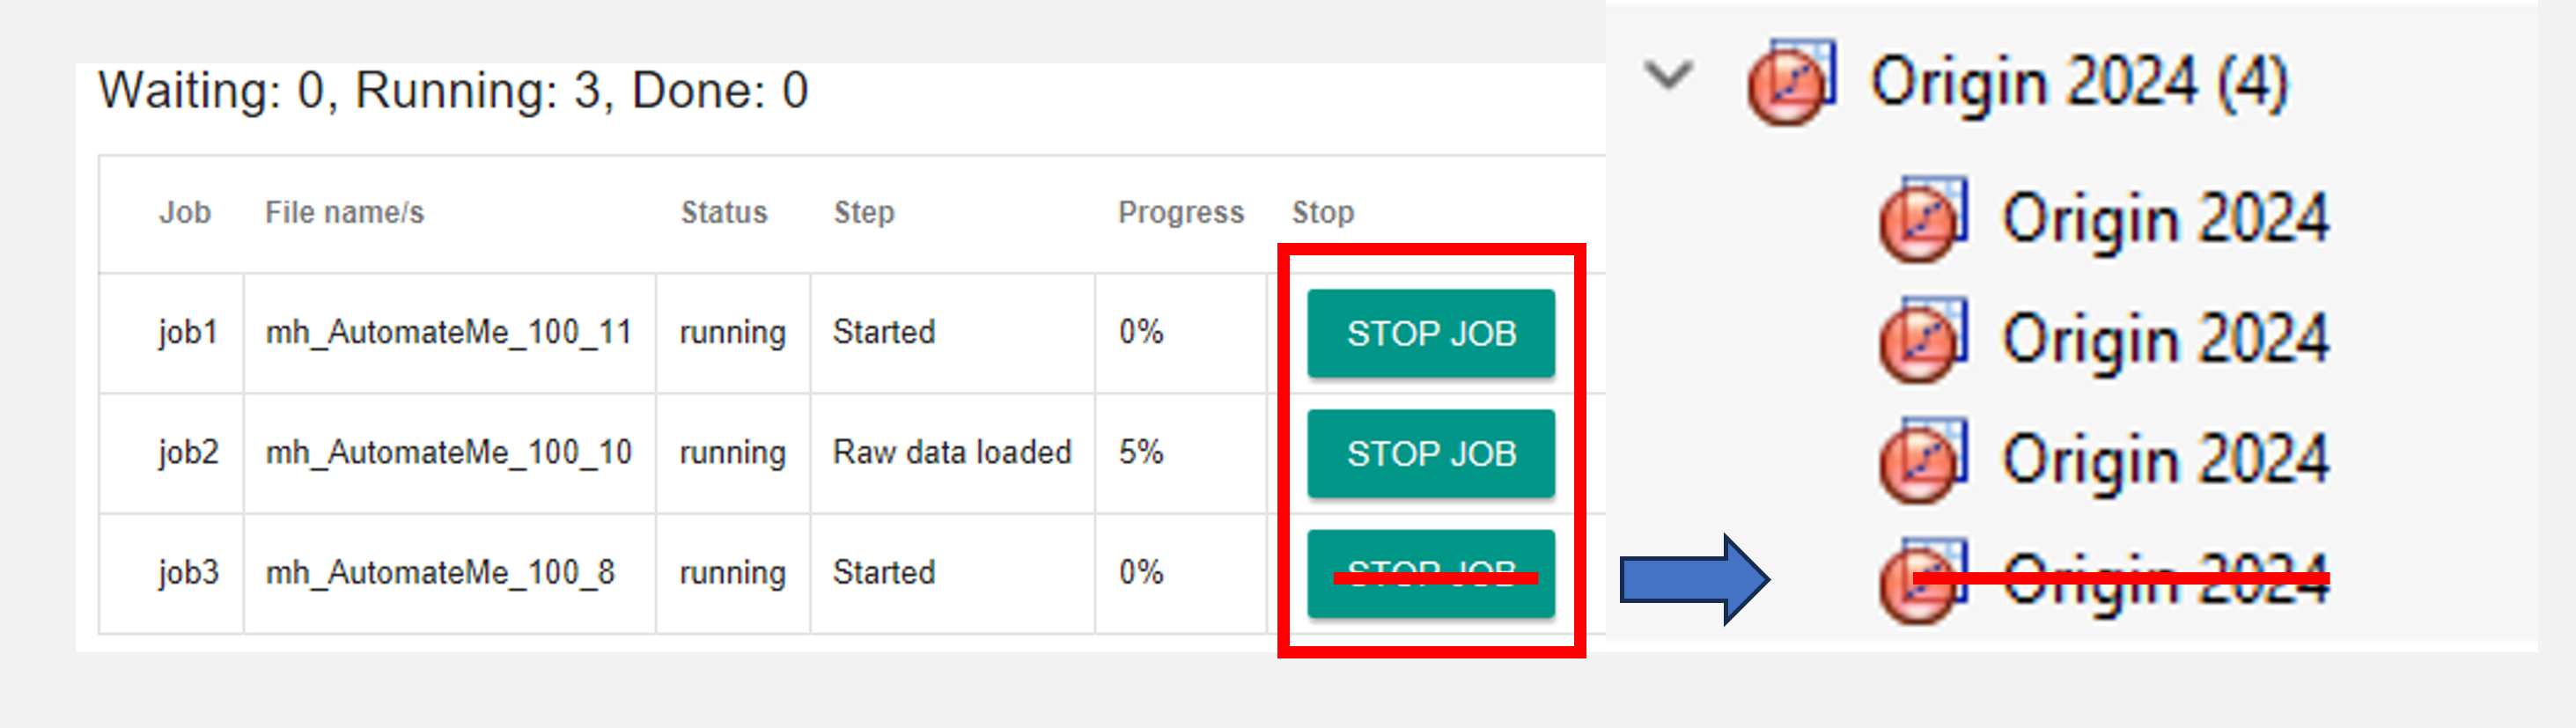
- Skip Evaluation → Stop Test - The feature to skip an evaluation when Data Analysis evaluates multiple test files was improved to stop the test more reliably. All corresponding Origin background processes are terminated.
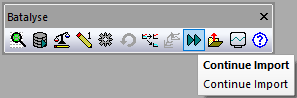
- Improvements and bug fixes with the Data Analysis continue import function in combination with our Collect database software.
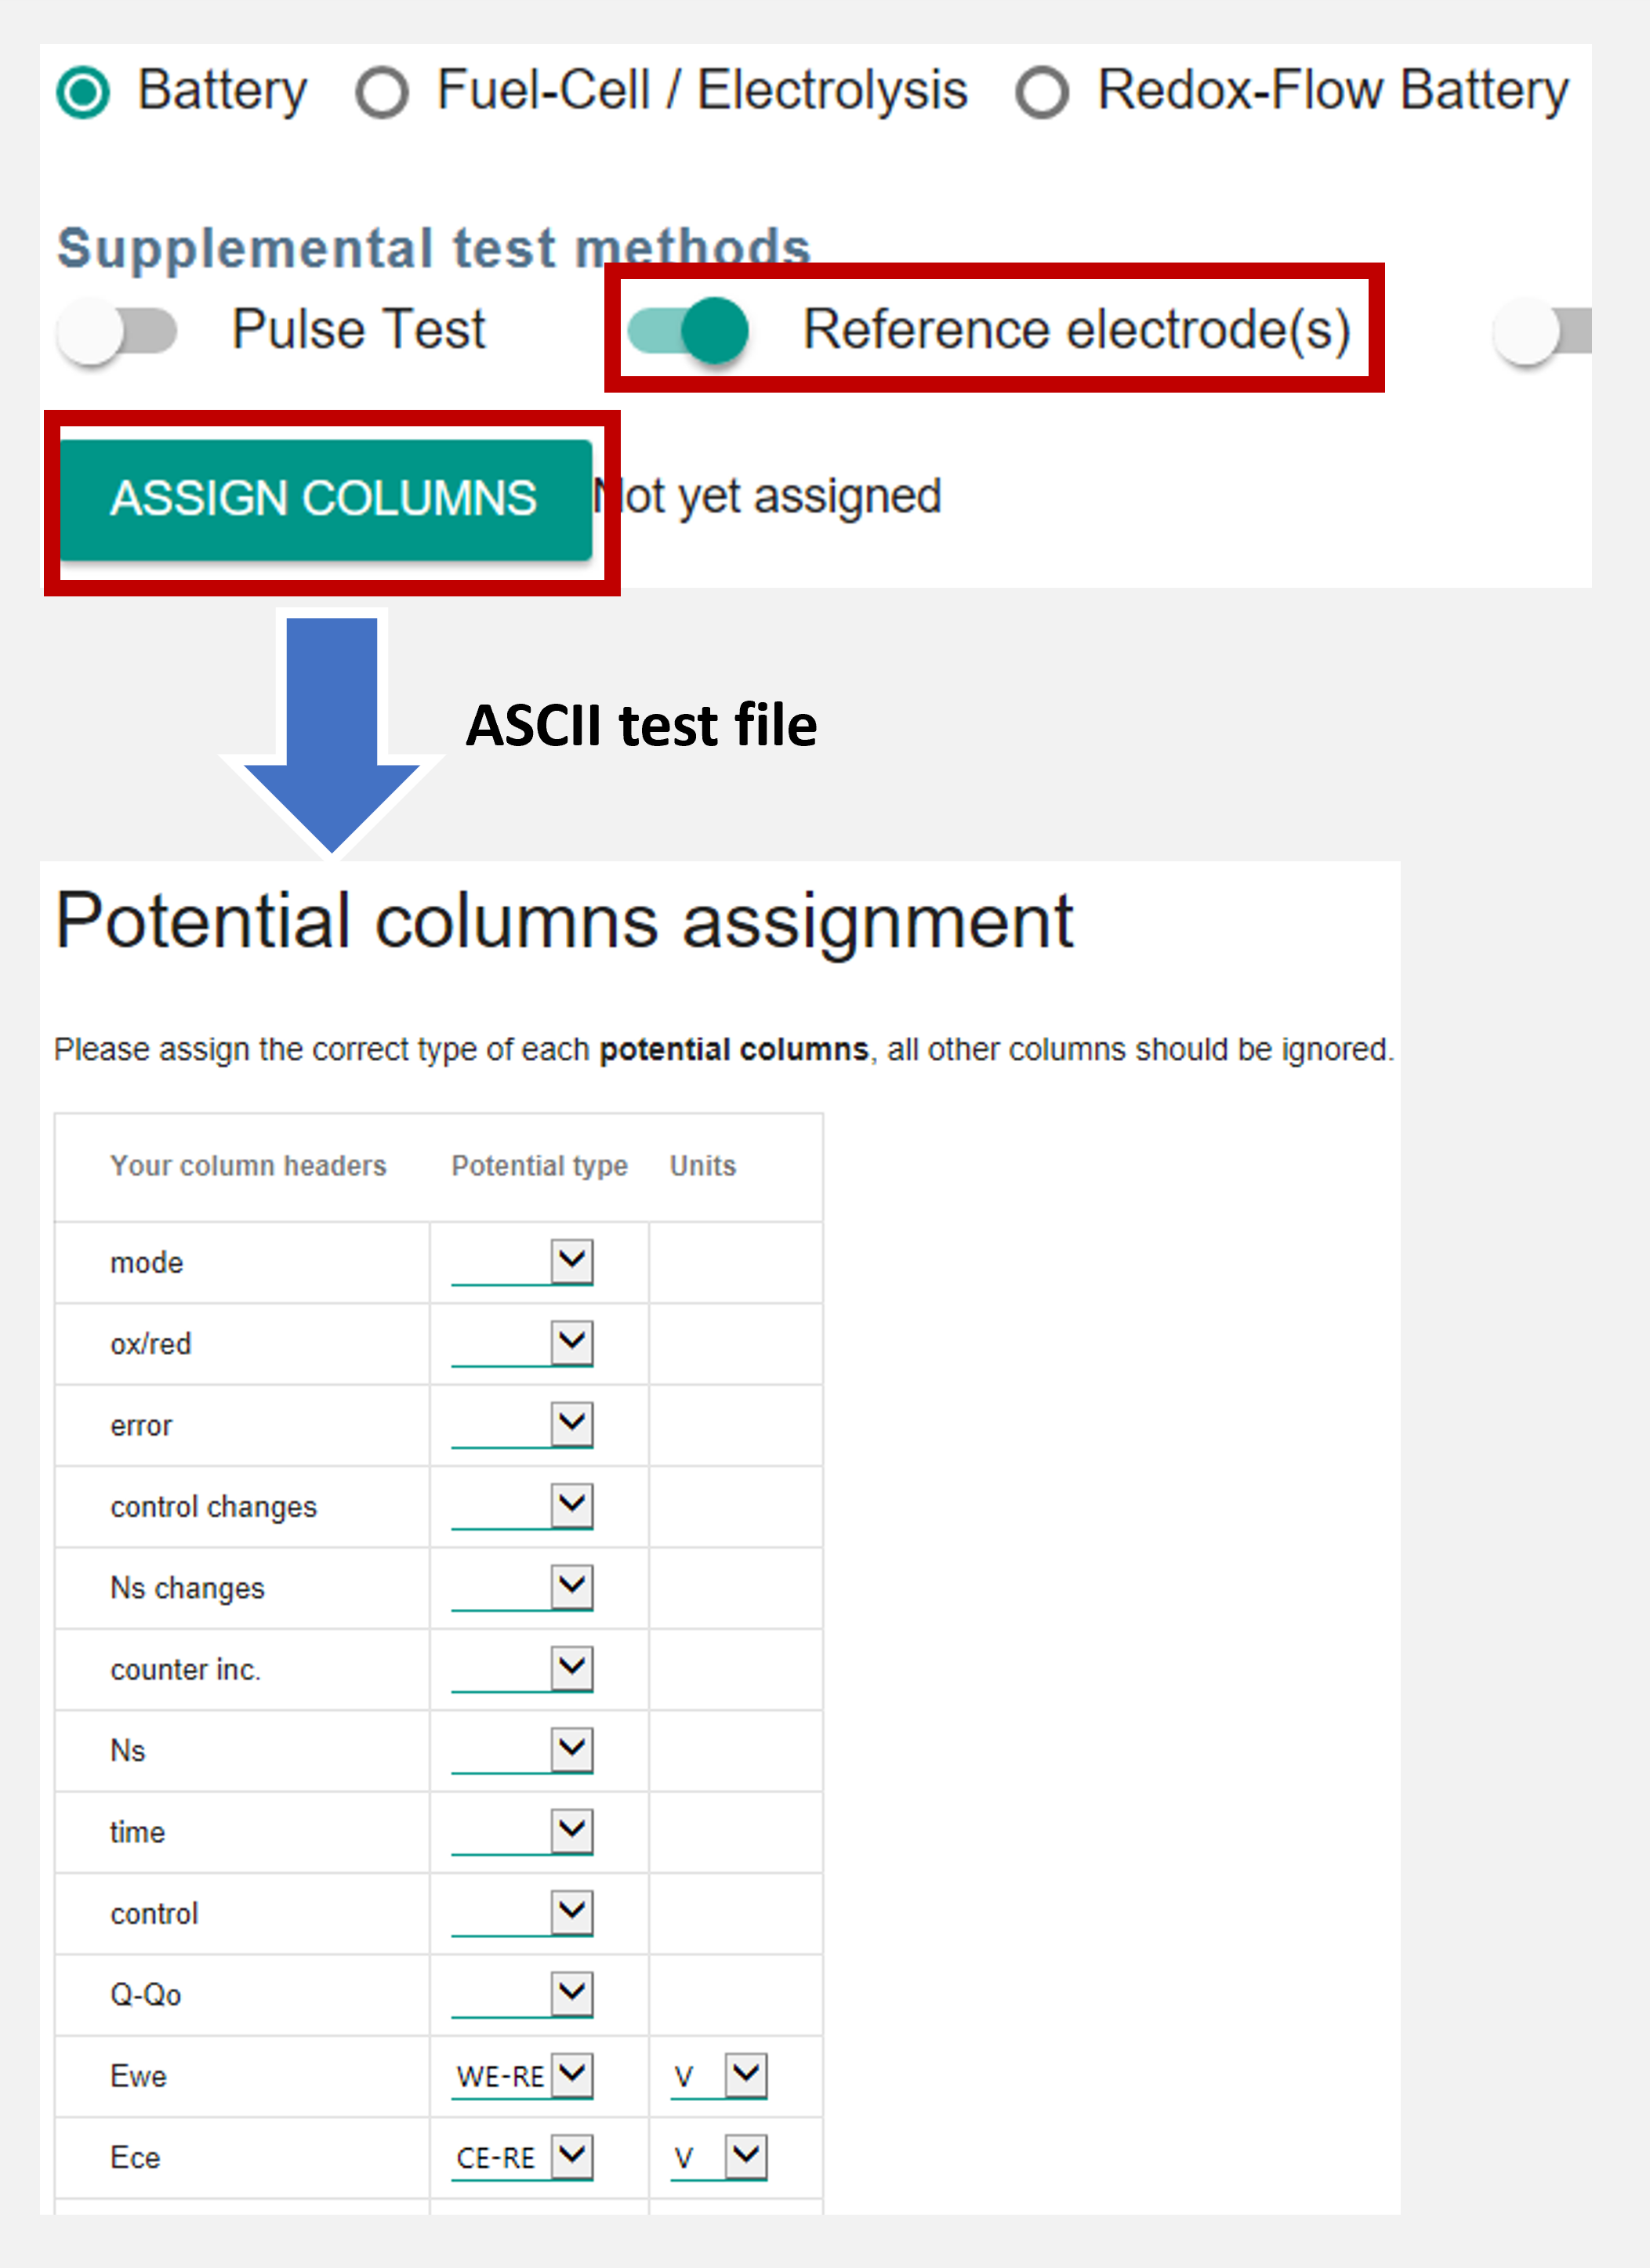
- Improved support for tests with reference electrode. The new Assign Colums feature allows editing your input in advance and after the evaluation process.
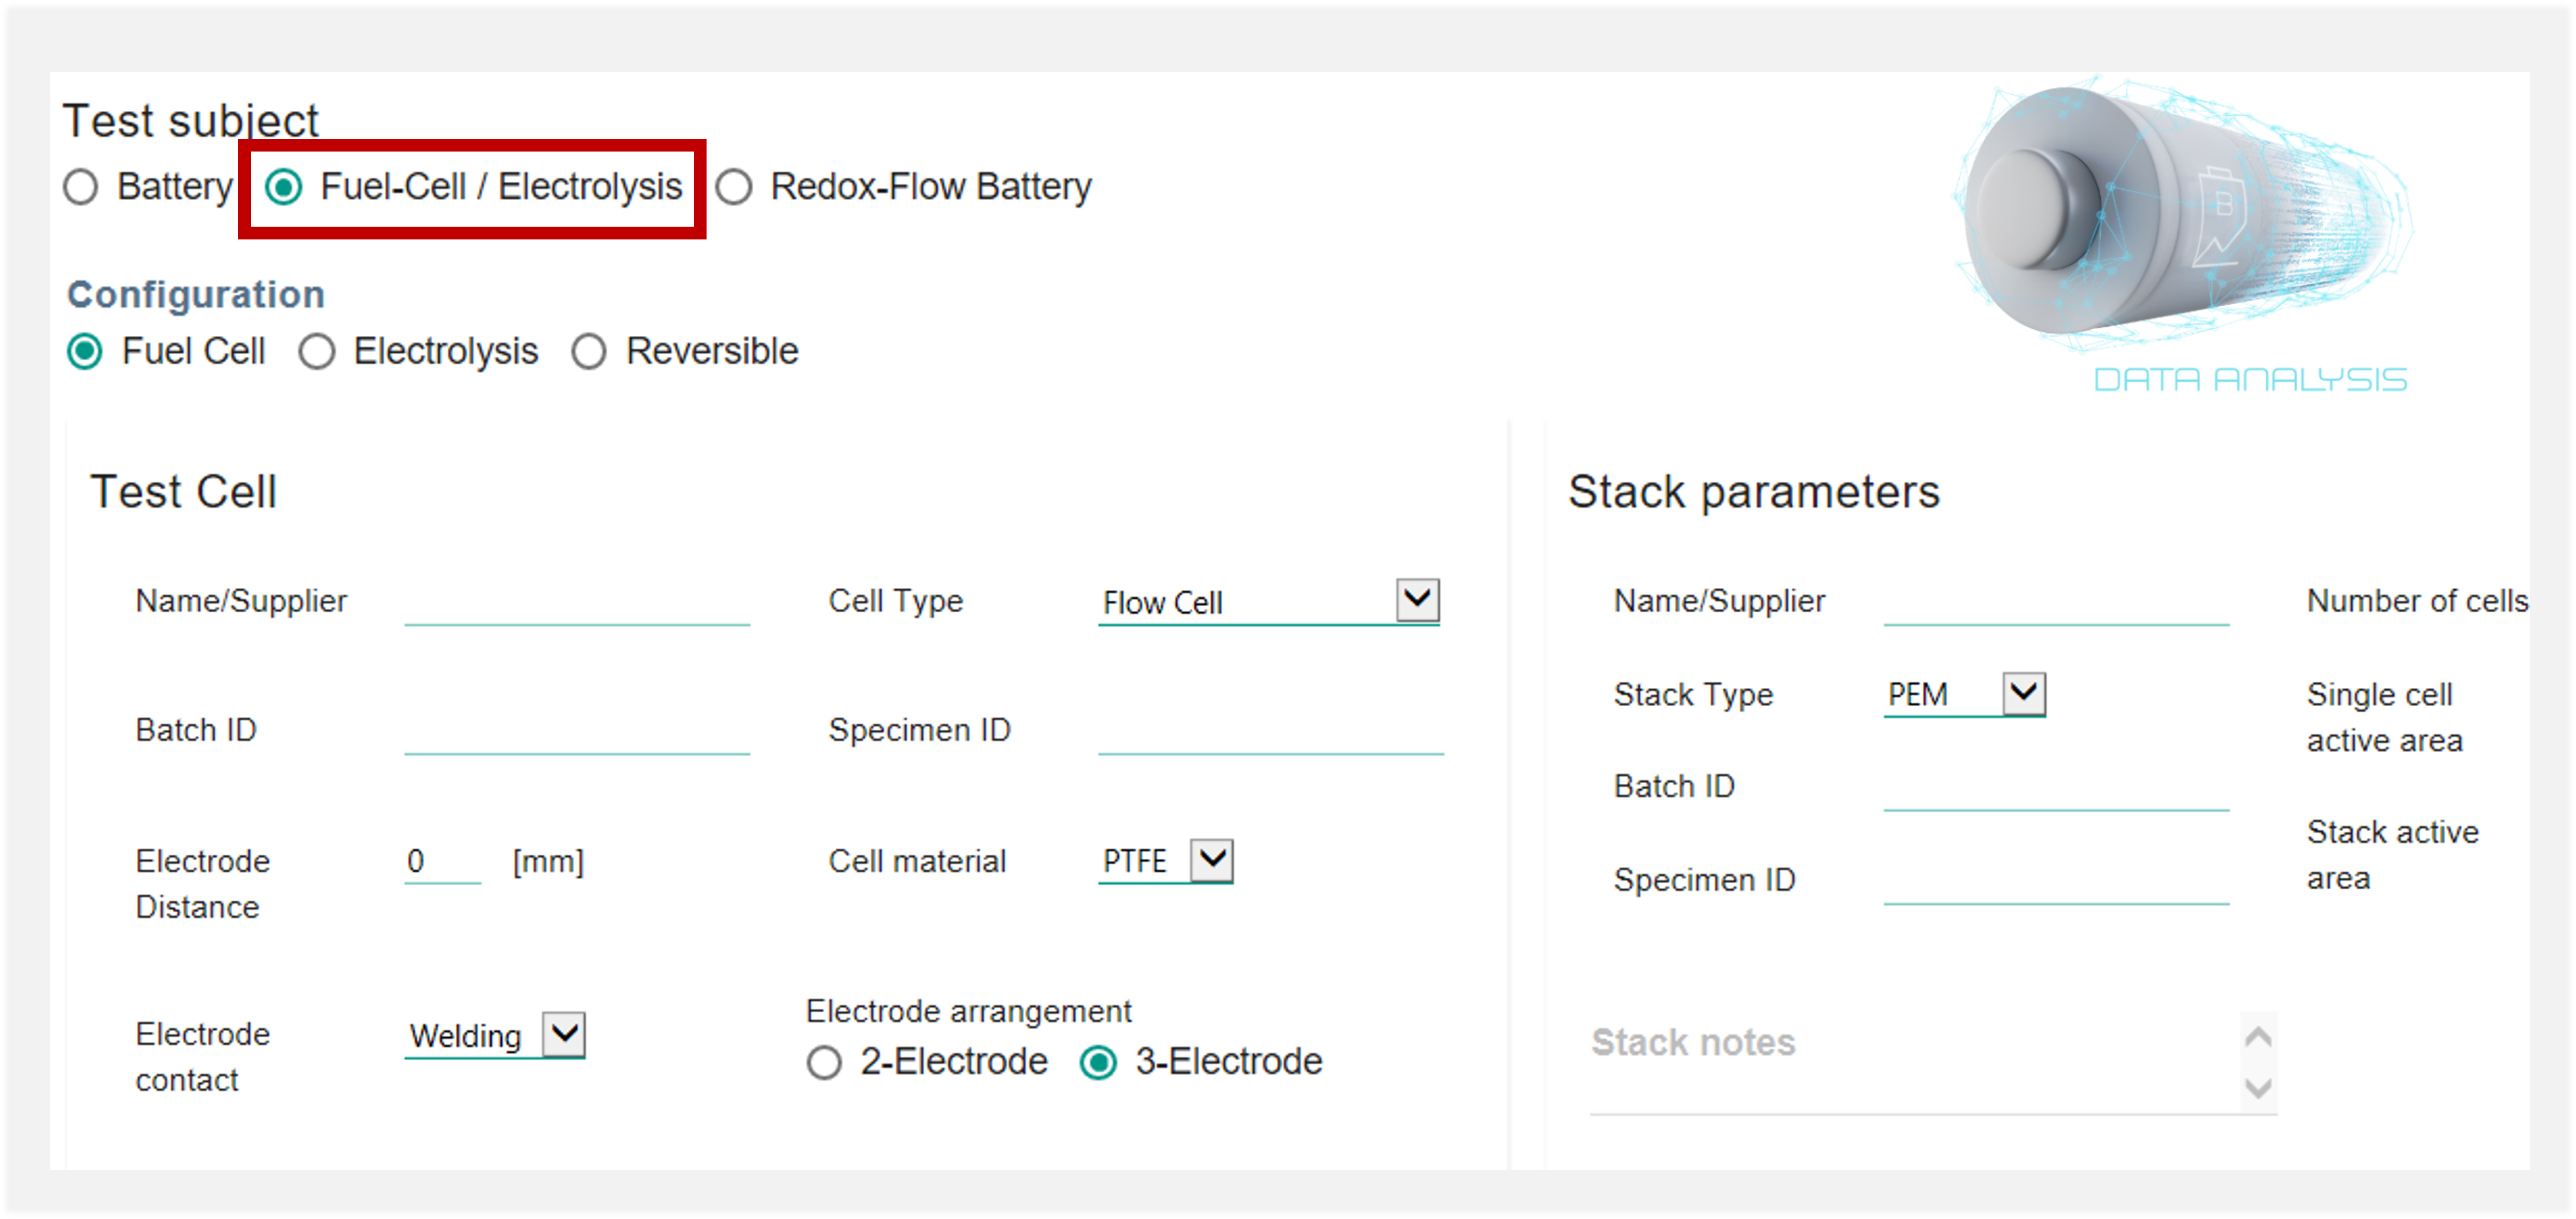
- New Fuel-cell / Electrolysis specimen dialog and parameters management
- New Origin connector to work with Lanhe/Landt .cex files. You can now also directly evaluate these .cex files with Data Analysis!
- Added new volumetric capacity comparison graphs
- Improved/updated support for many cyclers, multiple bug fixes and support of new file structures
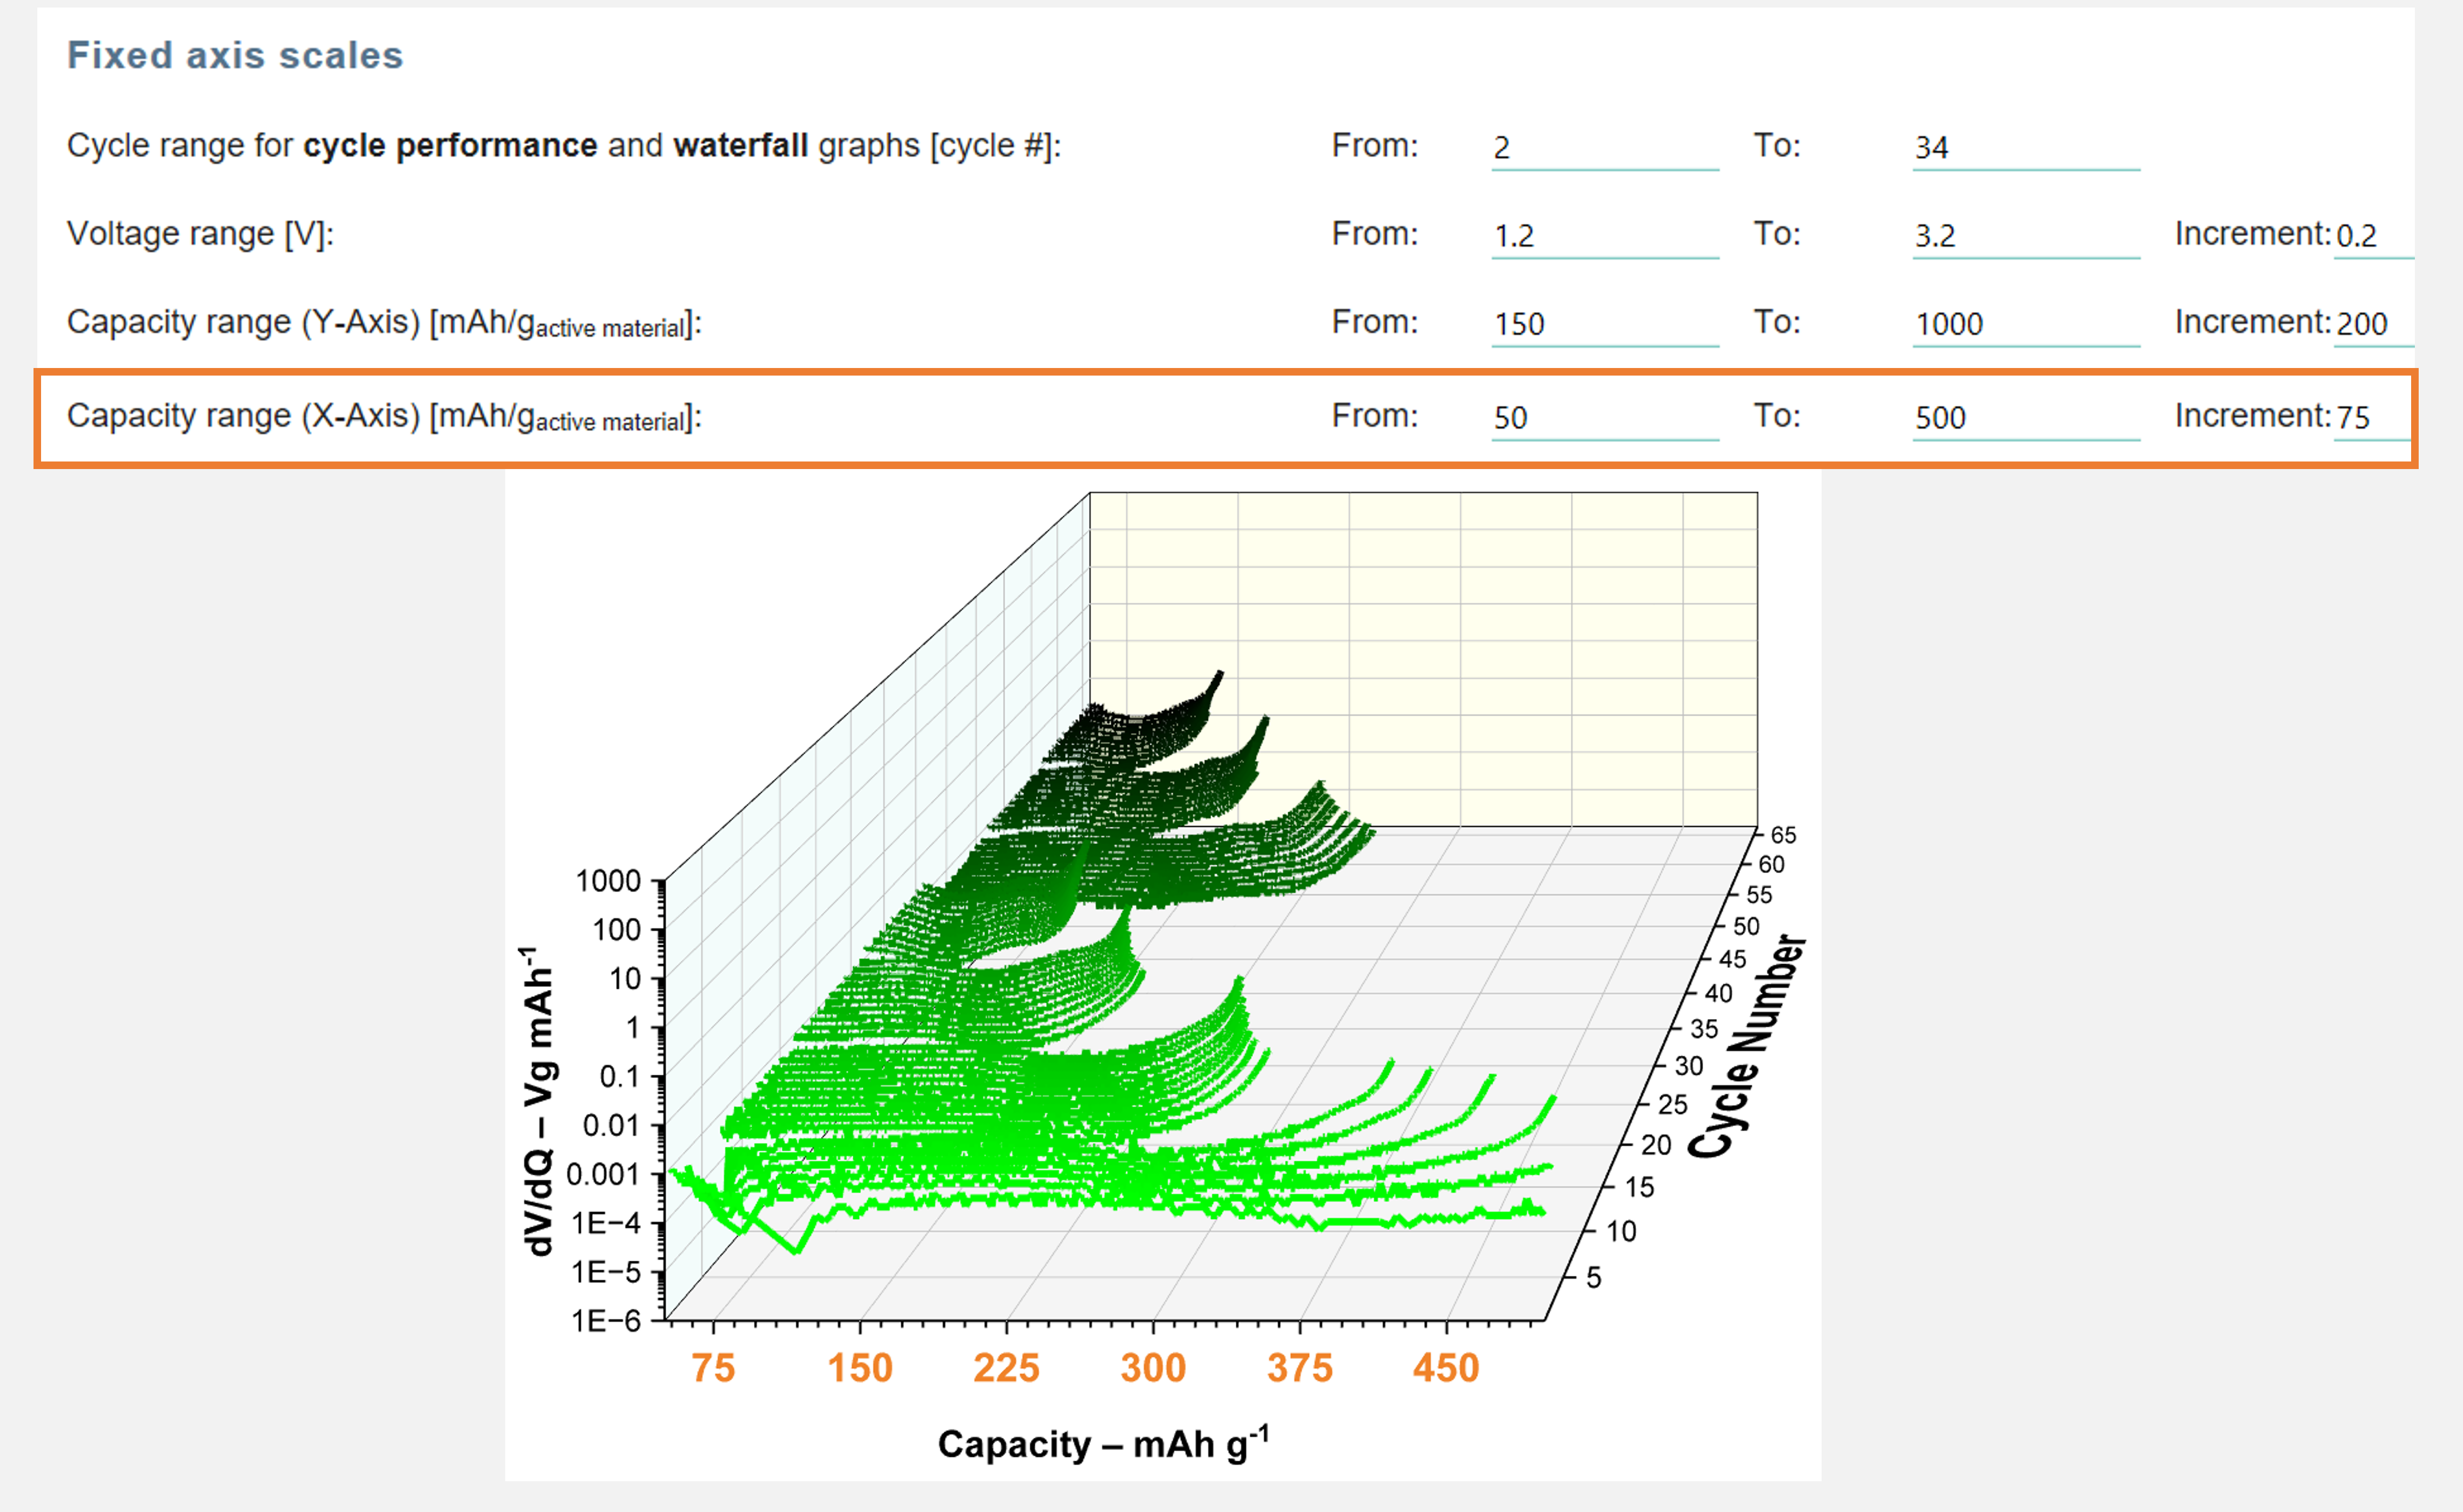
- Added an option for fixed X-axis scale for Capacity Axis
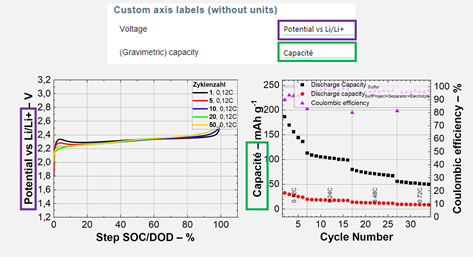
- Added an option for manually specifying axis titles for voltage and capacity axes
- Improved volumetric capacity graphs
- Hangke + Multi channel LVDT import support (from Collect)
- Fix support for capitalized "MPR", "XLS/S" file extensions
- Comparison CC-CV graphs
- Bug fixes
- Added voltage areal capacity comparison graphs
- Fixed “skip” function for collect-monitor, general improvement to “skip”
- Prevent some dialogs from opening in the background and halting the process
- Collect monitor error and progress improvements
- Improved test type detection
- Prioritize selected cycle for 100% Capacity and SOC over Nominal-Cap
- Support Maccor files with Voltage in µV
- Added axis title units separator and parts selection
- Coating and stack volumetric capacity comparison
- Support extracting active material and nominal capacity from some Neware file formats
- Added option to separate charge/discharge curves graphs
- Added option to load graph style from template
- Added option for fixed capacity/voltage scale ranges
- Added line thickness and symbol size and color selection
- Bug fixes
- Added dVA (dV/dQ) graphs
- Improved merge functionality to allow merging files with different columns, i.e. for different BioLogic methods
- Improved pulse graphs
- Added minimal dV ranges for differential graphs smoothing
- Relative loss + discharge capacity graph
- New option for selecting cycles to display with offset, i.e. you can enter 2+10 to show cycles 2, 12, 22…
- Improved waterfall diagrams
- Improved Ivium and BioLogic support
- Improved and fixed thickness measurement graphs, ability to merge thickness measurement data
- Multiple bug fixes
- Added voltage vs. areal capacity graph (single tests)
- Added end-of-charge/discharge-voltage graphs (single tests + comparison)
- Improved “Merge” function to support merging of additional file structures
- Added “Load” and “Export” Buttons to specific components inside the parameters dialog
- Improved 3-electrode diagrams
- New entry fields in the parameters dialog – notes, porosity, temperature and pressure
- Accuracy improvements for step type recognition and average current calculation, especially for steps with few data rows
- Multiple bug fixes
- Added voltage vs. areal capacity graph (single tests)
- Added end-of-charge/discharge-voltage graphs (single tests + comparison)
- Improved “Merge” function to support merging of additional file structures
- Added “Load” and “Export” Buttons to specific components inside the parameters dialog
- Improved 3-electrode diagrams
- New entry fields in the parameters dialog – notes, porosity, temperature and pressure
- Accuracy improvements for step type recognition and average current calculation, especially for steps with few data rows
- Multiple bug fixes
- Added voltage vs. areal capacity graph (single tests)
- Added end-of-charge/discharge-voltage graphs (single tests + comparison)
- Improved “Merge” function to support merging of additional file structures
- Added “Load” and “Export” Buttons to specific components inside the parameters dialog
- Improved 3-electrode diagrams
- New entry fields in the parameters dialog – notes, porosity, temperature and pressure
- Accuracy improvements for step type recognition and average current calculation, especially for steps with few data rows
- Multiple bug fixes
Werten Sie Ihre eigenen Dateien aus
Senden Sie uns einige Testdateien oder fordern Sie eine Demo-Lizenz an. Kostenlos und unverbindlich.
 Collect →
 EIS Analyzer →
 Mind →