

Impedanzspektren mit einem Klick validiert, gefittet und erklärt
Impedanzspektren importieren, validieren, per DRT analysieren, fitten und exportieren – vom einzelnen Spektrum bis zur ganzen Messreihe: als Desktop-Anwendung oder in Collect, wo die Fits bei der Zelle bleiben.
- Eine eigenständige Anwendung
- Eigenständig oder in Collect
- Lizenzen inklusive bei Data Analysis
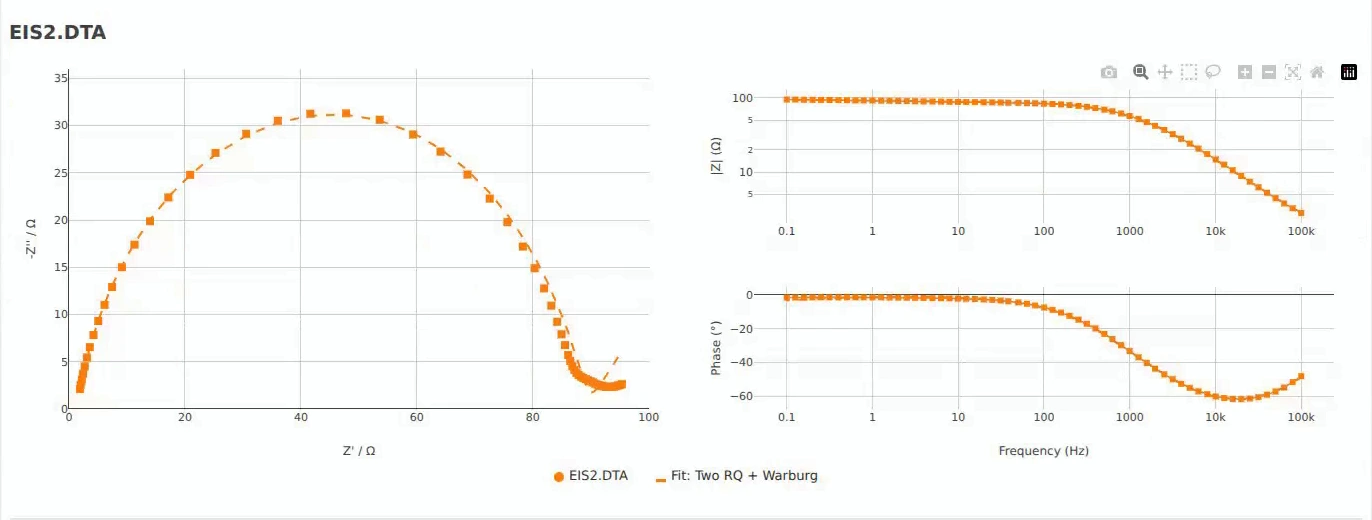
Vom Spektrum zu belastbaren Parametern
Importieren
Dateien vom Potentiostaten, aus einer Datenbank oder aus Collect öffnen. Bei Dateien mit mehreren Sweeps bleibt jeder Sweep erhalten.
Validieren
Kramers-Kronig zeigt Drift, Rauschen und nichtlineares Verhalten, bevor Sie fitten.
Verstehen
Die DRT trennt überlappende Prozesse und schlägt ein passendes Ersatzschaltbild vor.
Fitten und verfolgen
Fitten mit Grenzen und Nebenbedingungen, dann jeden Parameter über Zyklen, Ladezustand oder Temperatur verfolgen.
Exportieren
Bearbeitbare Origin-Projekte, CSV, XLSX, JSON und PNG mit Fehlern und Einheiten – oder die Ergebnisse direkt in Collect speichern.
Das kann EIS Analyzer
Ersatzschaltbild-Fitting mit voller Kontrolle
Einfache RC- oder CPE-Näherungen beschreiben poröse Elektroden nicht. Transmission-Line-Modelle schon.
34 integrierte Modelle Neu 2026
16 Ersatzschaltbilder vom einfachen Widerstand bis Randles-W, dazu 18 Transmission-Line-Modelle für poröse Elektroden: reflektierend, transmissiv und verschachtelt.
Eigene Schaltungen
Geben Sie einen Schaltungsstring ein; er wird vor dem Lauf geprüft.
Schaltbilder Neu 2026
Jedes Modell als IEC- oder US-Schaltbild: als PNG kopieren, als SVG oder PNG exportieren, außerdem im Grafik-ZIP und im Origin-Export enthalten.
Startwerte aus der DRT Neu 2026
Die DRT-Peaks liefern den Startpunkt für den Fit.
Fitting mit Nebenbedingungen Neu 2026
Jeden Parameter fixieren oder freigeben, seinen Bereich begrenzen, Werte über Sweeps hinweg teilen oder per Ausdruck verknüpfen. Basin-Hopping und Differential Evolution enden mit einer lokalen Feinoptimierung und liefern Fehlerbalken.
Simulationsmodus Neu 2026
Das Spektrum jedes Modells aus eingegebenen Werten zeichnen, ohne Messdaten.
Voreinstellungen für die Fit-Qualität
Schnell, Ausgewogen oder Hohe Präzision, mit Multistart-Rettung für schwierige Fits und Hinweisen zur Fit-Qualität nach jedem Lauf.
Fits nebeneinander vergleichen
Mehrere Dateien oder Modelle nebeneinander, jeweils mit χ² und Fehlern pro Parameter.
Visuelle Frequenzauswahl
Den Fitbereich per Klick auf das Spektrum wählen.
Erst die Prozesse sehen, dann das Modell wählen
Die Verteilung der Relaxationszeiten trennt überlappende Prozesse, ohne ein Ersatzschaltbild vorauszusetzen.
Automatischer Modellvorschlag
Die DRT ermittelt die Zeitkonstanten und schlägt ein geeignetes Ersatzschaltbild für den anschließenden Fit vor.
DCT und generalisierte DRT Neu 2026
Die Verteilung kapazitiver Zeiten sowie eine generalisierte DRT, die RC- und RL-Anteile trennt.
Peak-Erkennung Neu 2026
Peaks werden automatisch erkannt oder per Klick im Diagramm ergänzt; bearbeitete Peaks aktualisieren das vorgeschlagene Ersatzschaltbild und jeden Export.
Feinsteuerung Neu 2026
Regularisierung mit automatischer λ-Wahl einschließlich mGCV, Frequenzbereich und Peak-Empfindlichkeit sind einstellbar.
Aktivierungsenergie pro Peak Neu 2026
Jeder DRT-Peak erhält aus Spektren bei mehreren Temperaturen seine eigene Aktivierungsenergie.
Keine sauber aussehenden Fits aus ungültigen Spektren
Die Kramers-Kronig-Validierung läuft vor der Auswertung, nicht danach.
Kramers-Kronig-Prüfstand Neu 2026
Wählen Sie die gefitteten Komponenten, die Anzahl der RC-Glieder und das Frequenzfenster, das mit dem Fitting geteilt wird.
Einzelne Ausreißer ausschließen Neu 2026
Klicken Sie einen schlechten Punkt im Residuendiagramm an – ein einziger Netzbrumm-Punkt kann eine ganze Dekade verderben.
Drift-Warnung Neu 2026
Drift wird neben der Qualitätsnote markiert und in die JSON-, Origin- und KPI-Exporte übernommen.
Diagnose
Niederfrequenz-Bias, systematische Residuen, Modellordnung und verworfene Punkte werden ausgewiesen.
Alle Dateien auf einmal validieren
Eine Qualitätsbewertung pro Datei, gespeichert mit den Ergebnissen.
Vom einzelnen Spektrum zum Verhalten der Zelle
Gefittete Parameter werden zu Verläufen über die Lebensdauer der Zelle.
Parametertrends
Jeder gefittete Parameter oder χ² über Zyklen, Ladezustand, Spannung und Zeit, mit Fehlerbalken.
Arrhenius-Analyse Neu 2026
Aktivierungsenergie in kJ/mol und eV mit 95 % Konfidenzintervall, VTF-Vergleich und optionaler Leitfähigkeit.
Flächen- und spezifische Widerstände Neu 2026
Geben Sie Elektrodenfläche und -dicke ein, um Proben unterschiedlicher Geometrie in Ω·cm² oder Ω·cm zu vergleichen.
State-of-Health-Vorhersage
Schätzung von State of Health (SOH) und Temperatur aus EIS-Merkmalen per Machine Learning.
Eigene Modelle trainieren Neu 2026
Trainieren Sie ein Modell mit Ihren Ergebnissen und exportieren Sie es für den Einsatz an anderer Stelle.
Die Impedanz verfolgen, während die Zelle arbeitet
Ein eigener Arbeitsbereich für Operando-Impedanz.
Sweep-Gruppen
Eine Serie von Sweeps gruppieren und die gesamte Pipeline mit einem Klick für jedes Mitglied ausführen.
Parameterverläufe
Ladungstransferwiderstand, Kapazität und mehr über Ladezustand, Zeit oder Zyklus.
Heatmap der DRT-Entwicklung
Sehen Sie, wie sich SEI, Ladungstransfer und Diffusion entlang des Sweeps verschieben.
Beginn des Lithium-Platings
Markiert den Beginn des Platings als scharfen Abfall in einem Parameter Ihrer Wahl.
Stationaritätsprüfung
Eine Ampel pro Spektrum bewertet, wie stationär die Messung war.
Rohe Zeitreihen
Driftkorrigierte FFT gewinnt die Impedanz aus eigenen Potentiostat-Aufzeichnungen.
Linearitätsprüfung für Multisinus-Daten Neu 2026
Jeder Kanal roher Multisinus-Daten wird als linear, leicht, stark nichtlinear oder nicht prüfbar eingestuft; DMFA wählt seine Filterbandbreite automatisch.
Ganze Messreihen in einem Lauf
Was für eine Datei funktioniert, funktioniert auch für hundert.
Auto-Analyze
DRT, Fitting, Validierung und Merkmalsextraktion als eine Pipeline über alle geladenen Dateien.
Stapelverarbeitung
Mehrere Dateien werden parallel verarbeitet; lange Läufe lassen sich abbrechen.
Origin-Export
Bearbeitbare .opju-Projekte mit vollständig formatierten Grafiken, jedem Fit und seinem Verlauf.
CSV, XLSX, JSON, PNG
Mit Fehlern und Einheiten pro Parameter.
Projekte
Eine Sitzung mit allen Einstellungen und Ergebnissen speichern und als eine Datei weitergeben.
Grafik-Vorlagen
Farben, Marker, Schriften und Achsen als wiederverwendbare Stilvorlagen.
Professional +
Fit-Ergebnisse, die bei der Zelle bleiben
Eigenständig ist ein Fit ein isoliertes Ergebnis. In Collect wird er zu Daten.
Integriert in Collect Professional und Automation; Add-on für Collect Standard.
Dauerhaft gespeichert
Fit-Parameter liegen neben den Probeninformationen und Zyklisierdaten derselben Zelle.
Vergleichbar über Messreihen hinweg
Impedanzergebnisse filtern, sortieren und mit Material-, Prozess- und Alterungsdaten korrelieren.
Unbegrenzte Nutzerzahl
Alle an Ihrer Einrichtung können Spektren im Browser analysieren.
Über die API verfügbar
Fit-Ergebnisse sind für Ihren eigenen Code und KI-Assistenten lesbar.
Eigenständig oder integriert in Collect
Beide führen dieselbe Analyse aus. Der Unterschied liegt darin, was mit den Ergebnissen geschieht: Eigenständig ist ein Fit eine Datei auf einem Rechner; in Collect wird er zu Daten, die Ihr ganzes Team filtern, vergleichen und wiederverwenden kann.
| Eigenständige Anwendungauf Ihrem Rechner | Integriert in Collectim Browser | |
|---|---|---|
| Fitting, DRT, Kramers-Kronig, Arrhenius, Dynamic EISDieselbe Analyse in beiden | ||
| Installation | Auf jedem Rechner | Keine Installation nötig |
| Nutzer | Ein Rechner pro Lizenz | Unbegrenzte Nutzerzahl an Ihrer Einrichtung |
| Zugang zu den Spektren | Dateien öffnen oder aus einer Datenbank bzw. Collect laden | Bereits vorhanden: automatisch erfasst und kategorisiert |
| Wo die Ergebnisse liegen | In Projektdateien und Exporten | Dauerhaft bei der Zelle gespeichert, neben ihren Proben- und Zyklisierdaten |
| Vergleich über Messreihen | Von Hand, nach dem Export | Als Ergebnisspalten, die Sie filtern, sortieren und mit Material-, Prozess- und Alterungsdaten korrelieren |
| API und KI-AssistentenFit-Ergebnisse für Ihren eigenen Code lesbar | — | |
| Funktioniert ohne ServerSofort einsatzbereit, keine Infrastruktur | — | |
| Lizenz | Mit jeder Data-Analysis-Lizenz oder als PC-Lizenz | Collect Professional und Automation; Add-on für Standard |
Neu in EIS Analyzer
Updates sind in der Lizenz enthalten. Die vollständige Liste steht im Änderungsprotokoll.
DCT und generalisierte DRT
Die Verteilung kapazitiver Zeiten, eine generalisierte DRT mit getrennten RC- und RL-Anteilen und mGCV als weitere automatische λ-Wahl.
Version 2.7.2Simulationsmodus und Schaltbilder
Das Spektrum jedes Modells ohne Messdaten zeichnen und jedes Modell als IEC- oder US-Schaltbild in der App und in Exporten darstellen.
Version 2.7.2Arrhenius-Analyse
Aktivierungsenergie aus Spektren bei mehreren Temperaturen, mit Konfidenzintervall und Plausibilitätsprüfungen.
Version 2.6.2Lassen Sie die Daten das Modell vorschlagen
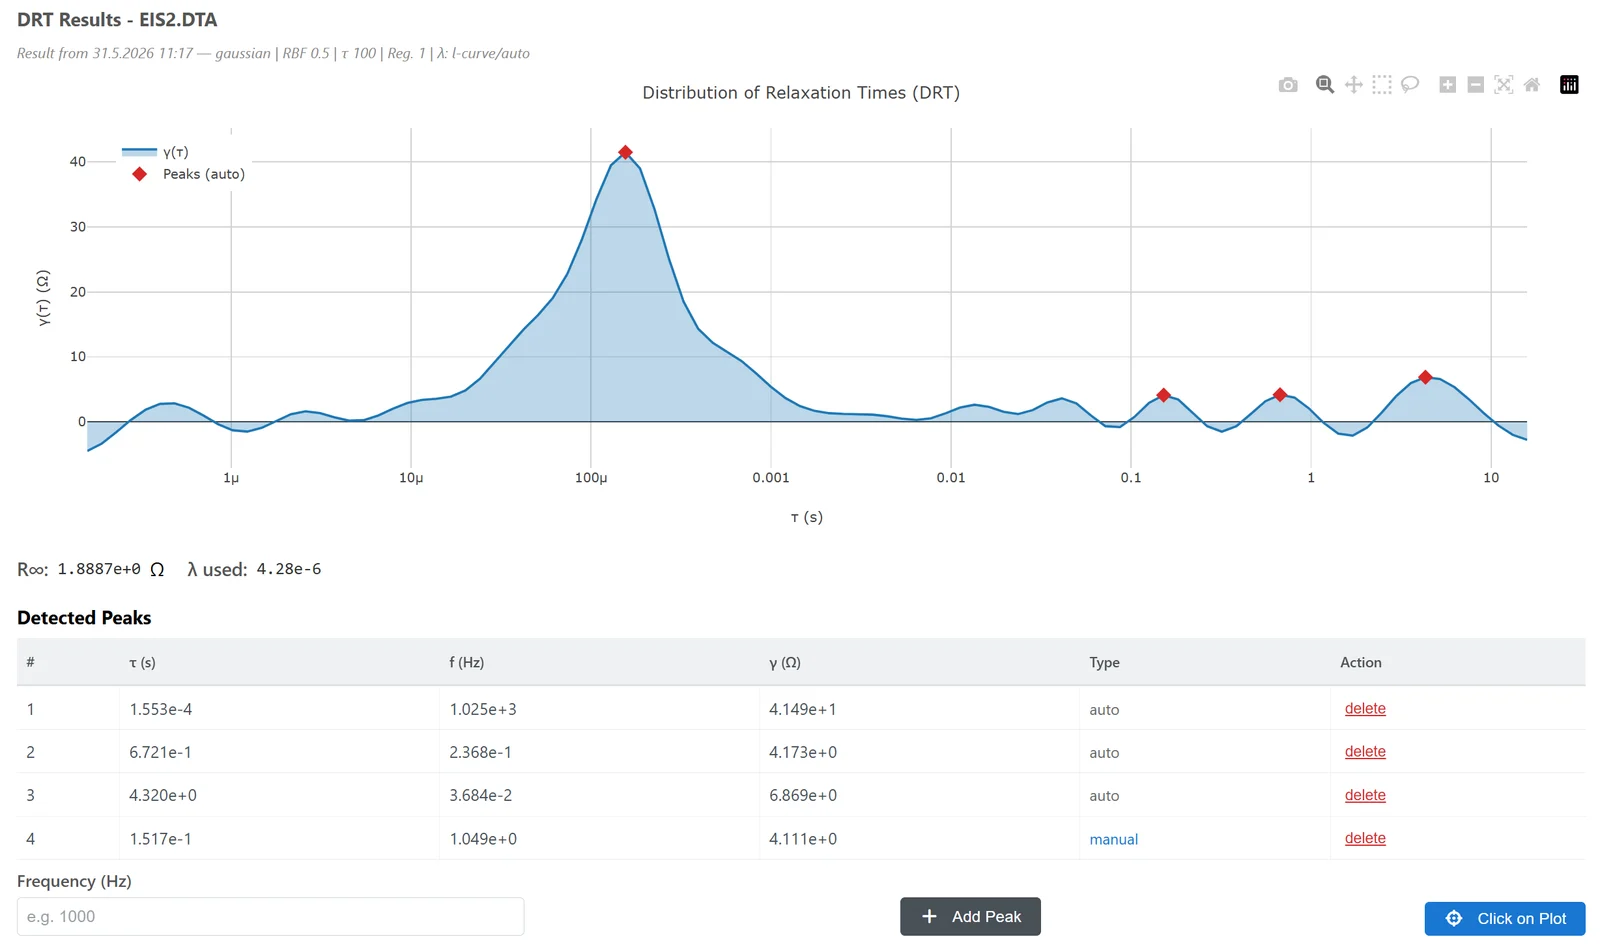
Die DRT findet die Zeitkonstanten in Ihrem Spektrum und schlägt das passende Ersatzschaltbild für den Fit vor.
- Modellfreie Trennung überlappender Prozesse
- DCT und generalisierte DRT (RC + RL) neben der klassischen DRT
- Automatische oder manuelle Peak-Auswahl
- Vorgeschlagenes Ersatzschaltbild und Startwerte gehen direkt in den Fit
Liest die Impedanzdateien Ihres Potentiostaten
Dateiformate
- Bio-Logic (.mpr, .mpt)
- Gamry (.DTA)
- Solartron (.z)
- PalmSens (.pssession, PSTrace Excel)
- Zahner (.ism)
- CH Instruments (.txt, .prn)
- Keysight (.csv)
- FuelCon (.csv)
- Maccor (Text und binär)
- SAFION (.csv, .irf)
- Novocontrol WinDETA (Text)
- NeXus operando (.nxs)
- Text und CSV (.txt, .dat, .csv)
Textexporte mit drei Elektroden werden geladen, Auf- und Ab-Sweeps werden in zwei aufgeteilt. In Collect liest der EIS Analyzer zusätzlich die Zelltester-Formate, die Collect importiert. Neue Formate werden kostenlos ergänzt.
Verbindet sich mit
- Batalyse Collect
- OriginLab Origin
- MySQL
- Microsoft SQL Server
- Data Analysis (in Collect)
Impedanzanalyse auf Ihrem eigenen Rechner
Entwicklung und Support in Deutschland, deutsches Recht, direkter Kontakt zu den Entwicklern.
Auf Ihrem Rechner
Die Desktop-Anwendung läuft lokal; Batalyse hat keinen Zugriff auf Ihre Daten. Offline-Lizenzen werden in netzwerkgetrennten Laboren über eine Datei aktiviert.
Nichts wird gezählt
Auswertungen werden weder gezählt noch protokolliert.
Reproduzierbar
Projekte halten Spektren, Fits, Einstellungen und Verlauf zusammen.
Drei Wege zur Lizenz
Jede Variante enthält alle Funktionen, Support und Updates.
In jeder Lizenz enthalten, Services und Dauerlizenzen
In jeder Lizenz enthalten
- Automatisiertes Fitting mit 34 integrierten Modellen: 16 Ersatzschaltbilder und 18 Transmission-Line-Modelle; Dynamic EIS
- DRT-Analyse, die das am besten passende Ersatzschaltbild vorschlägt
- DCT und generalisierte DRT (RC + RL)
- Kramers-Kronig-Validierung mit Residuendiagnose und Ausschluss einzelner Ausreißer
- Arrhenius-Analyse mit einer Aktivierungsenergie pro DRT-Peak
- Flächen- und spezifische Widerstände aus Elektrodenfläche und -dicke
- State-of-Health-Vorhersage per Machine Learning und trainierbare Modelle
- Parallele Stapelverarbeitung: DRT, Fitting, Validierung und Vorhersage in einem Lauf
- Liest Bio-Logic, Gamry, Solartron, PalmSens, Zahner, CH Instruments, Keysight, FuelCon, Maccor, SAFION, Novocontrol und Textformate
- Import aus Collect und SQL-Datenbanken
- Export nach Origin (.opju), CSV / JSON und Grafikarchive
- Benutzerhandbuch in 14 Sprachen, Oberfläche in 11
Services und Lizenzoptionen
Reduzierte Preise für Forschungseinrichtungen, Hochschulen, Start-ups und KMU, für mehrere Module und mehrjährige Lizenzen. Der Lizenzrechner liefert eine Schätzung, den Preis nennt Ihr Angebot.
EIS Analyzer herunterladen
Windows-Desktop-Anwendung; sonst ist nichts zu installieren. Fordern Sie eine kostenlose Demo-Lizenz direkt in der App an; Data-Analysis-Kunden haben bereits eine Lizenz. In Collect läuft der EIS Analyzer stattdessen im Browser.
Frühere Versionen: Batalyse_EIS_Analysis_Setup_2.6.2.zip · Batalyse_EIS_Analysis_Setup_2.6.0.zip
Versionshistorie von EIS Analyzer
Die Versionshinweise sind auf Englisch.
Version 2.7.2
- Distribution of capacitive times (DCT) alongside the DRT
- Generalised DRT with separate RC and RL contributions
- mGCV as a further automatic choice of the DRT regularisation parameter λ
- Simulation mode: draw any model's spectrum from entered values, without measured data
- Linearity check for raw multisine data per channel (linear / mild / severe / untestable), and DMFA with automatic filter bandwidth
- Circuit diagrams for every model as an IEC or US schematic: copy as PNG, export as SVG/PNG, included in the graphs ZIP and the Origin export
- Better fits
- Start values can come from the DRT
- Constrained and joint fits run the solver you choose; Basin-Hopping and Differential Evolution finish with a local polish and report error bars
- Fit-quality tips after Evaluate
- New transmission-line models: TLM-Q with contact-resistance arc or cable inductance, TLM with a Randles-type pore wall; physical limits for all TLM parameters
- Kramers-Kronig: drift warning beside the grade and in the JSON, Origin and KPI exports
- Edited DRT peaks update the recommended circuit, are marked detected or manual in all exports, and feed the Arrhenius analysis
- New readers: Zahner, CH Instruments (CHI660E and CHI760E), Keysight, FuelCon and SAFION .irf
- Bio-Logic .mpr and .mpt give the same points, 3-electrode text exports load, and an .mpr still being written is read up to its last complete point
- Up/down sweeps are split in two; impedance in mΩ or kΩ is converted to Ω
- The ends of the DRT/DCT τ grid are shown as edge contributions and no longer appear as or hide real peaks
- Analyze Cycles uses complete cycles only; capacity in mAh and current in mA for every reader
- Measurement files containing XML entity declarations are refused
- User guide updated in all 14 languages
Version 2.6.2
- Activation energy from multi-temperature EIS in kJ/mol and eV with a 95% confidence interval
- All available resistances fitted side by side
- ln(1/R) or ln(T/R) forms
- Optional conductivity in S/cm
- Activation energy per DRT peak
- Built-in plausibility checks
- Noisy data and a wrong physical model are reported separately
- VTF comparison for polymer electrolytes
- Sweeps with drifting temperature are flagged
- Temperatures read per sweep from Gamry, Solartron and other supported files, so temperature ramps can be analysed as measured
- Arrhenius results in every export
- KPI table, CSV/JSON and saved results
- Origin projects with a dedicated worksheet and graphs
- CSV fallback for users without Origin
- Fully translated, with the user guide covering the Arrhenius workflow in all 14 languages
- Improved Origin legends and plot customization
- Faster switching between resistances
- Correct electrode area in current-density calculations
- Several table and export fixes
Version 2.6.0
- Kramers-Kronig validation is now a full test bench: choose which components the model is fitted to (complex, real or imaginary), how many RC elements it uses, whether a series capacitance is added, and whether all points or only the capacitive ones are fitted — with one frequency window shared with Fitting and Auto-Analysis, so a fit and its validation can no longer describe two different parts of the same spectrum
- Exclude single bad points by clicking them on the residual plot — removing one mains-pickup point at 50 or 100 Hz can rescue a spectrum that looked poor across a whole decade; new diagnostics report low-frequency bias, how systematic the residuals are, the model order actually used and how many points were dropped, and every file can be validated at once with the results kept per file and per sweep
- Electrode geometry per file: enter an electrode area and thickness and every result follows the geometry — including a new areal Nyquist plot in Ω·cm² and a resistivity Nyquist plot in Ω·cm for homogeneous through-plane layers such as solid electrolytes, separators, pellets and coatings, so samples of different geometry can be compared on one plot
- Choose the equivalent circuit for Auto-Analysis instead of always inheriting the one DRT suggests — including your own circuit, which is checked before the run rather than failing part-way through — and every fit of a sweep is now kept, with the newest marked as the latest by its own date
- Where each extremum sits, not only how large it is: the frequencies at which the real part, the imaginary part, the magnitude and the phase reach their extremes, plus the arc peaks
- Train a model on your own results and export it for use elsewhere, with the preprocessing included in the exported file; new temperature-prediction transform and cross-validation that sizes itself to how much data you actually have
- Novocontrol WinDETA exports open directly; Novocontrol files no longer read the imaginary part as the real one, and Neware NDA v8 files are read correctly including previously misaligned values
- Saving to Collect now writes the areal and resistivity plots too, and the save dialog lists the images each file will produce and states plainly that overwriting removes everything already stored against that test
- EIS result columns show the last evaluation of each sweep and mark a cell when a newer evaluation left it empty, so one column no longer means two different things across rows
- Operando measurement files open in the EIS Analyzer, including very large ones, which are now prepared in the background instead of holding up the page
- The licence window fits on one screen — request form and activation field side by side — and the request form explains what is expected of it, in particular that the email address should be your organisation's
- Polish and Ukrainian join the interface languages and the user guide is available in Arabic and Turkish again; tooltips now read as words in every language, where German, Japanese, Chinese, Korean, Hindi and Ukrainian previously showed raw character codes in around ninety labels each
- Installing and updating: the application reports its version in Windows' own file properties, upgrading from 2.3.x or older no longer leaves the previous program file behind, a licence can require a minimum application version, and the installer packs everything needed for model export
- Further fixes: spectra without a low-frequency intercept (blocking electrodes, coatings, separators) now validate, the quality score no longer comes out blank after an Auto-Analysis run, model inputs are matched by name rather than by position, a comparison receives the Origin file its own export produced, and the Origin project contains the resistivity plot when a thickness is known
Ältere Versionen
- SAFION IE10522 support: the multi-section EIS_DATA_CH*.csv exports from the SAFION cycler now load directly (frequency, real and imaginary impedance)
- In-app updater fixed: it now runs the downloaded installer instead of silently doing nothing, so updates actually apply and relaunch the app — no admin rights needed
- "The control does nothing" bugs fixed across DRT, fitting, auto-analysis and Customize: DRT now honors every advanced option (enforce-positive, basis, regularization order, RBF shape, inductance handling, imaginary-only — positivity on by default), the differential-evolution fit method works, and Customize controls (stationarity v_ref, areal-Nyquist export, legend label, DRT fill opacity, electrode area, legend/title previews) all take effect
- More robust parsing: Bio-Logic .mpr (empty / TCUS / Rdc files, VMP3 structural headers, duplicate column IDs, LOG device/channel metadata) and Maccor V1/V2 binary, with clearer "insufficient data" messages for non-EIS files
- PalmSens .pssession import restored in Batalyse Collect — now byte-identical to the standalone app
- Unified the non-EIS rejection message and tidied preset save/library handling
- In-app user guide updated and translated across all 10 languages (EN/DE/ES/FR/IT/PT/JA/KO/ZH/HI), including the new Fit Quality presets and SAFION support
- New Fit Quality preset (Fast / Balanced / High precision) across the Fitting, Auto-Analysis and DEIS Fit-all menus; High precision adds a multi-start rescue for tricky fits
- Dynamic EIS: two new derived trajectory quantities — effective double-layer capacitance C_dl (Brug) and the kinetic ratio H = σ_W/R_ct — selectable and included in exports
- Fixes: grouped Fit Results after multi-file fits; Parameter Trend stays visible on the Voltage x-axis without metadata; Compute SOC from current reads header metadata; manual fits converge to full precision again
- New dedicated Dynamic EIS (DEIS) tab — sweep groups, trajectory plots, stationarity checks, DRT-evolution heatmap, and lithium-plating onset all in one place
- DEIS Auto-analyze: full analysis pipeline (DRT, fit, K-K, features) on every sweep with a live progress overlay — results populate all views in one click
- Parameter Trend analysis: track fitted circuit parameters across cycles/sweeps with error bars, per-model curves, cycle-compare overlays, and a cycle-aware x-axis
- Maccor support: parses both Maccor EIS text and V2 binary FRA spectra, accepts numeric extensions (.001, .002, …)
- Origin export: Parameter Trend graphs now plot against real trajectory coordinates (SOC %, voltage, or cycle) instead of a bare sweep counter
- Save and reload DEIS sweep groups as self-contained .batalyse bundles (spectra + fits + metadata)
- New Fit Results grid: one card per cycle/model, per-sweep fit history, fit timestamps
- Unified Export dropdown with Parameter Trend in Origin .opju, per-parameter errors + units in CSV, dated filenames
- Cancellable Auto-Analysis and Fitting with a live progress overlay
- Bio-Logic GEIS: auto-import preserves all sweeps; cycling rows feed the Non-EIS tab and Polarization auto-analysis
- Three-electrode handling: correct Im(Z) sign-correction for normalized columns and per-curve output
- Stationarity grading now aligns with the K-K Quality Reference (mean-residual grade)
- In-app user guide expanded and fully translated into 10 languages (EN/DE/ES/FR/IT/PT/JA/KO/ZH/HI), including a Dynamic EIS chapter
- Much faster Auto-Analysis on difficult spectra, more reliable online-license check, and numerous stability fixes
- Standalone and Collect builds merged into a single unified codebase
- Drift-FFT waveform inspector — visualize the drift that was removed — and coherent averaging for multisine waveforms (√N noise suppression)
- Per-member inspector and DRT evolution heatmap across a DEIS sweep
- DEIS group auto-analyze: full pipeline across every member with one click
- Fit-all progress streaming via SSE — live per-member feedback
- Export a single group as a .batalyse bundle for sharing
- Linearity (odd-multisine) + LF-noise-floor checks on drift-FFT imports
- SOC coulomb-counting sanity warnings (sign flips, duplicates, out-of-range)
- Plating detector: CUSUM change-point method alongside threshold
- Trajectory overlay: compare two DEIS groups on one plot
- CSV and XLSX export of DEIS trajectory data
- Lithium-plating onset detector on DEIS trajectories
- Raw time-series import with drift-corrected FFT (Hann window, polynomial detrend)
- DEIS: batch 'Fit all' for every group member with one circuit model
- DEIS: automatic SOC fill via coulomb counting
- Dynamic EIS sweep groups: trajectory plots and stationarity checks across multiple spectra
- Auto-import multi-curve files (Bio-Logic .mpr multi-loop) as a DEIS group
- K-K tab: per-member traffic-light stationarity summary for DEIS groups
- Project files (.batalyse) preserve DEIS groups on save/load
- New in-app License Key field for offline activation — paste the key sent alongside your .lic file to unlock AES-encrypted machine files
- Bundle licenses now work with the new offline activation flow
- Updated offline activation guide and diagnostic messages
- Origin .opju export: all fits (current + history) exported with matching colors and circuit-model labels
- Origin .opju export: Bode plots now overlay fit curves; new KK_Nyquist graph added
- Fit result cards show Fix / Shared / Min / Max / Expression badges per parameter
- Silent update check on startup with 'New version available' banner
- Unified Initial Parameter Values and Advanced Constraints into a single table
- K-K Validation: unified quality scoring — eliminates contradictory results
- Fitting: DRT-guided initial guesses, half-circle C_dl estimation, multi-start TRF optimization
- Fixed missing fit residuals graph when frequency range is filtered
- Fixed untranslated DRT / K-K / Export content on language switch
- Improved custom circuit validation and auto-estimation
- Added 14 Transmission Line Models (TLM) for porous electrode analysis
- Added constrained fitting with parameter bounds, fix/free, and expressions
- Added multi-language support (9 languages)
- Improved visual frequency selection with multi-sweep overlay
- Complete rewrite: new FastAPI + TypeScript web architecture (replaces Streamlit)
- Native desktop window via pywebview with browser fallback
- DRT Analysis with circuit model recommendation, SOH and temperature estimation
- Auto-Analysis pipeline, graph customization presets, project import/export
- SQL database connectivity, PalmSens .pssession support, Origin .opju export
- Automatic update checking with rollback support
- Customization Library for graph presets, DRT peak extraction in Auto Analysis
- Customize Graphs tab with per-file styling, fonts, and export selection
- Origin export with KK_Nyquist graph and multi-file comparison plots
- Offline license activation, SQL injection protection, startup-directory fixes
Analysieren Sie Ihre eigenen Spektren
Senden Sie uns einige Impedanzdateien oder fordern Sie eine Demo-Lizenz an. Kostenlos und unverbindlich.
 Data Analysis →
 Collect →
 Mind →