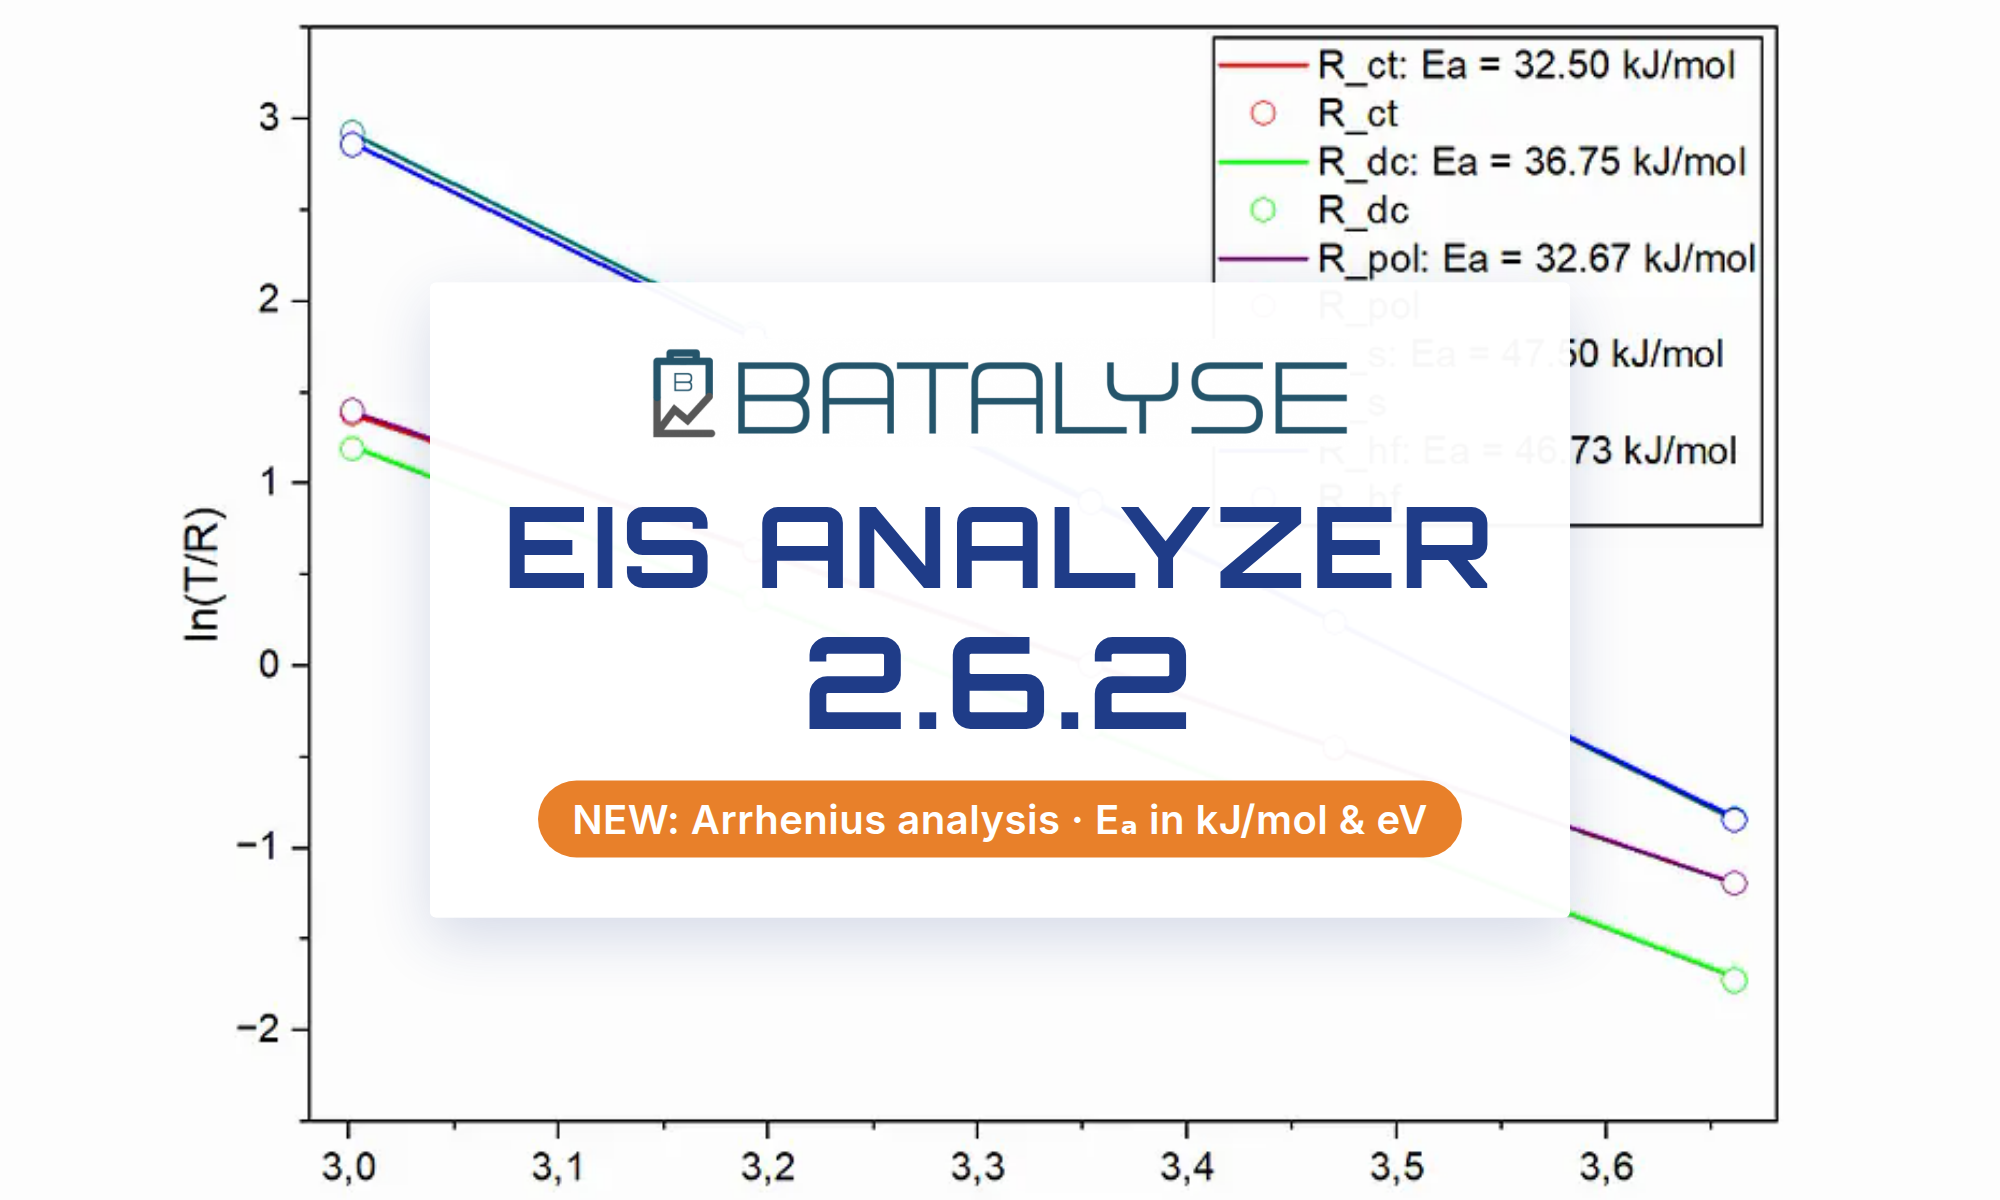
EIS Analyzer 2.6.2 is here. The headline of this release is a brand-new Arrhenius analysis: measure a cell at several temperatures and the Analyzer calculates the activation energy in kJ/mol and eV — with a proper 95% confidence interval, every resistance fitted side by side, and the result carried into every export, including Origin projects.
The Batalyse EIS Analyzer is a desktop application for analyzing Electrochemical Impedance Spectroscopy (EIS) data from batteries, fuel cells, supercapacitors and electrochemical sensors — from raw data import through equivalent-circuit fitting, DRT analysis and Kramers-Kronig validation to Origin (.opju) and CSV export. With 2.6.2, temperature-dependent studies no longer need a spreadsheet detour: the step from impedance spectra to activation energy happens right where you fitted them.
New: Arrhenius analysis — activation energy from your EIS data
A new Arrhenius tab takes spectra measured at several temperatures and plots the resulting resistances against 1000/T. The slope gives the activation energy Ea, reported in kJ/mol and eV together with a Student-t 95% confidence interval — so a three-point temperature series is not given the false certainty of a large data set.
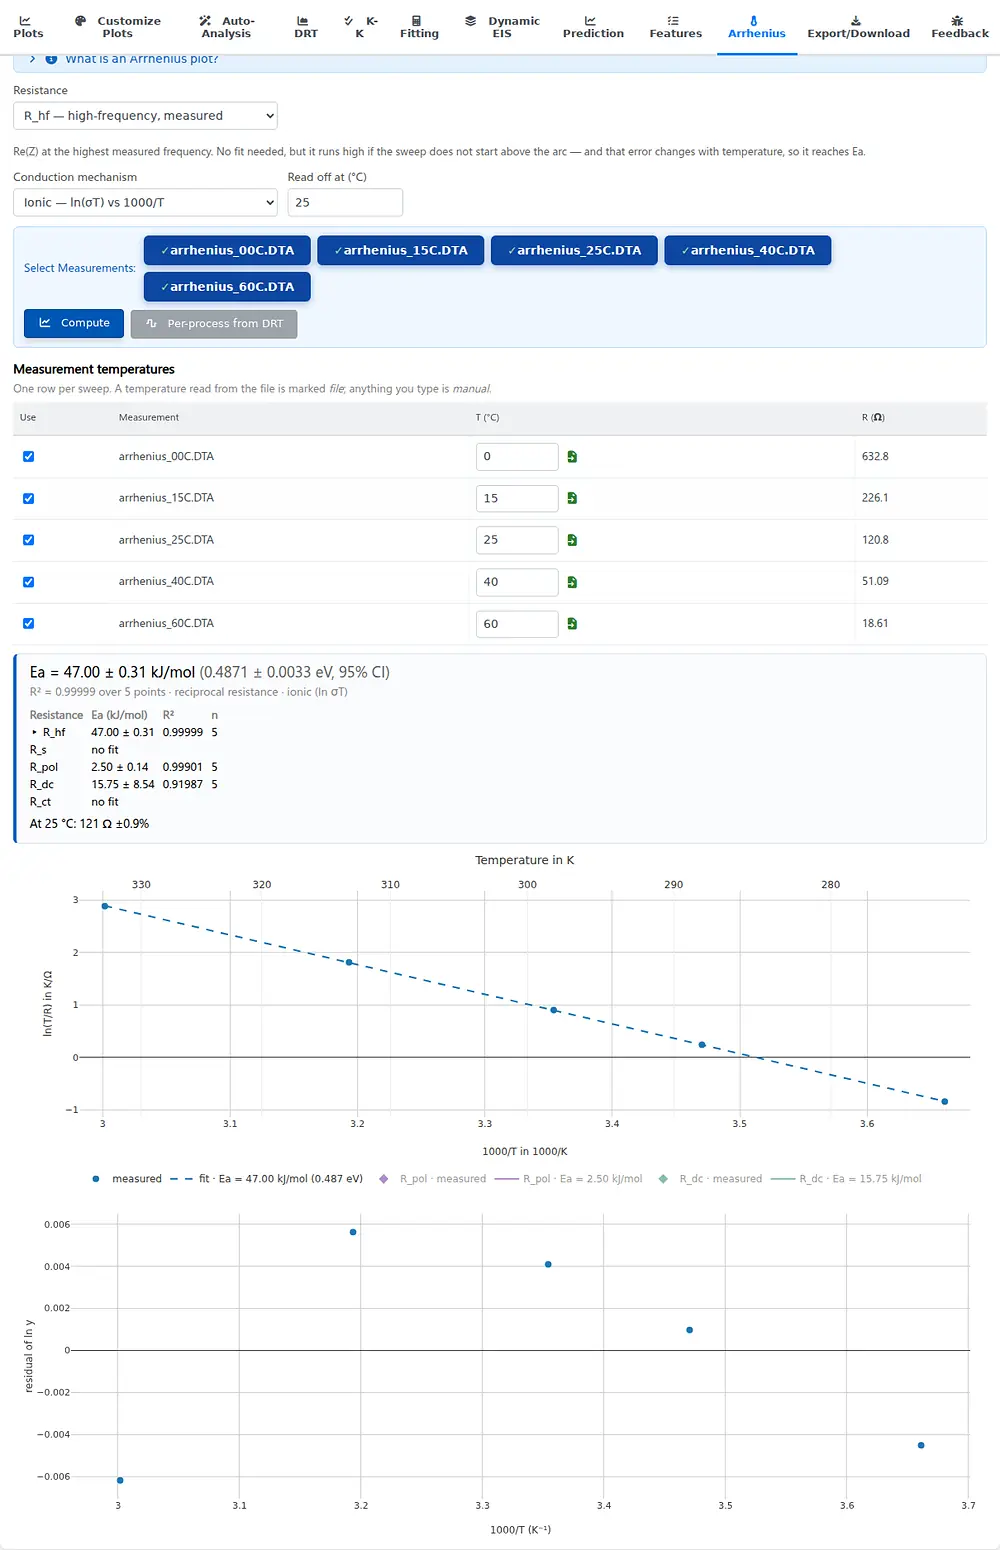
- Every resistance at once — high-frequency (Rhf), series (Rs), polarization (Rpol), direct-current (Rdc) and charge-transfer (Rct) resistance are fitted side by side. Click a row to promote it to the headline, graph and export.
- The right physical form — ln(1/R) for electronic conduction and charge transfer, or ln(T/R) for ionic conduction, with an optional read-off temperature (e.g. the resistance at 25 °C).
- Conductivity when you need it — enter electrode area and thickness and the plot is expressed as conductivity in S/cm, without changing the activation energy.
- Per-process activation energies from DRT — Ea can be calculated for each matched DRT peak, honouring the Fitting tab’s frequency window and refusing mismatched peak sets rather than pairing unrelated processes.
Honest fits: noisy data vs. the wrong model
A straight line is not always the right answer. The Analyzer tells the two failure modes apart: a low R² reports imprecise data, while curved residuals trigger a separate warning together with a Vogel–Tammann–Fulcher (VTF) comparison — the model of choice for polymer electrolytes.
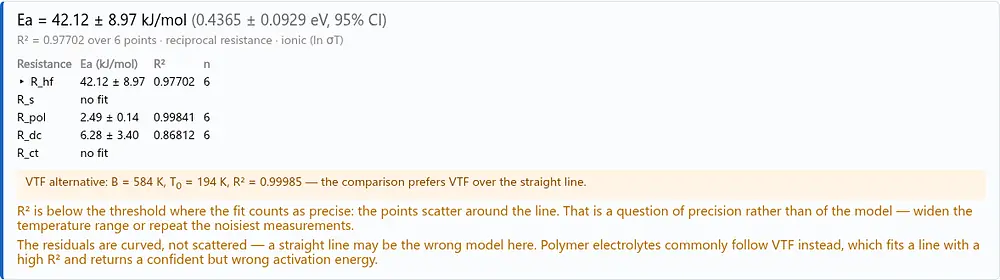
Because Rhf is a measured point, the Analyzer also explains when a sweep ending on the arc may run it high and suggests the fitted series resistance instead. A sweep whose temperature drifted during the measurement is flagged, so a mathematically neat line cannot hide an unsettled climate chamber.
Temperatures straight from your files
Each sweep supplies its own temperature. A temperature ramp recorded as one multi-sweep file is analysed as measured, and temperatures embedded in Gamry, BioLogic, Solartron (ZPlot), generic CSV and Excel files reach the Arrhenius table automatically — Gamry files even provide the electrode area. Anything you type by hand is remembered.
Arrhenius results in every export
Arrhenius results follow the rest of your analysis everywhere: the KPI table, CSV and JSON downloads, the graphs archive, saved results and Origin projects. Origin gains an Arrhenius worksheet and dedicated graph pages — residuals, one graph per fitted resistance and a combined comparison in the same colours used in the Analyzer, honouring your Customize Plots settings.
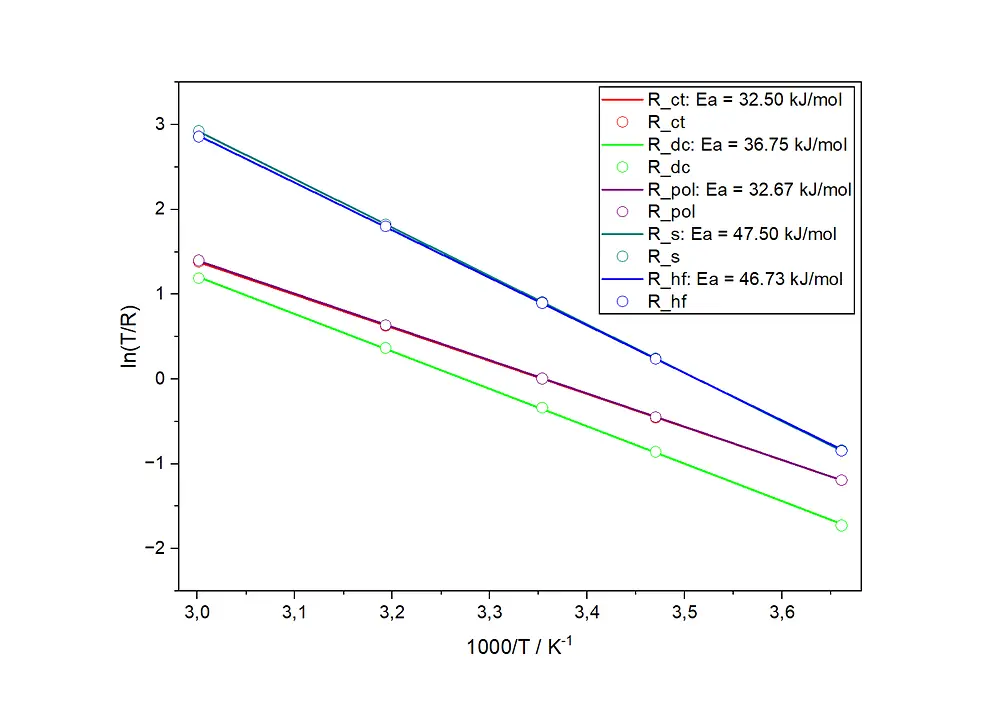
No Origin? You get the same analysis as CSV: one row per measurement plus a summary with activation energies, confidence intervals and the VTF comparison. Export also confirms immediately that it was triggered, including when the Analyzer is opened through Collect.
More improvements and fixes
- Fully translated — every Arrhenius message and the complete Arrhenius workflow in the in-app user guide are available in all 14 languages.
- The electrode area entered for a file now reaches polarization current-density calculations, and copying area or thickness to every file no longer discards the cell being edited.
- Choosing series or charge-transfer resistance without a circuit fit now asks you to run Fitting first instead of reporting missing temperatures.
- File-table date filters use the same local calendar day shown in the table, wherever you are relative to UTC.
Get 2.6.2: update from inside the app, or download the latest installer from the EIS Analyzer page. (Version 2.6.1 was built but never published, so 2.6.2 follows directly on 2.6.0.) Questions or feedback on the new Arrhenius analysis? Write to us at support@batalyse.com — we’d love to hear how it works with your temperature series.