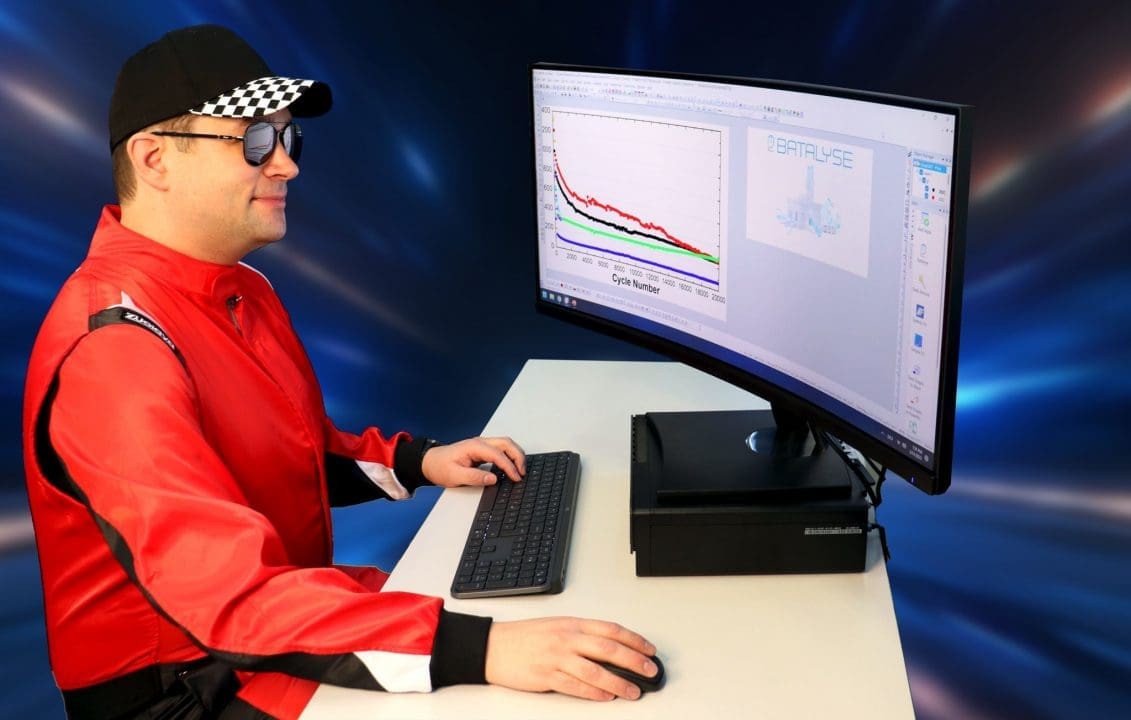
Data Analysis - Save Time & Effort
Data Analysis


Test options
Data Analysis can be tested for free and without obligation
- Download Data Analysis, unzip the archive
- Install by drag-and-drop to opened Origin window on your computer
- Sent us a license request. We will contact you when the license is active
- Batalyse has no access to your test data and results

Requirements
Data Analysis requires the graphing and analysis software “Origin” as a platform. It can be installed on any office computer.
- Requires Origin 2022b or better newer versions
- Origin Pro is not required


Download Data Analysis
Data Analysis installation manual
Change Log
- Data Analysis now automatically installs the proprietary file format connectors for .mpr and .cex files and a python package. You no longer need to manually install or update these connectors when installing or updating Data Analysis. Batalyse plans to add more connectors in collaboration with OriginLab in the coming months.

- Improved and expanded specimen dialog.

- Code Optimization – Automated pulse/HPPC fits – faster calculations, especially when handling a large number of measurement points during the pulse.
- New comparison graph: Discharge and charge capacity for each selected test over the cycle number vs Coulom Efficiency / Voltaic Efficiency / Energy Efficiency.

- Polarization graphs available for single tests now also added for comparisons.

- Improved support for supercaps: New result graphs, labelling options and expanded calculation table.

- The axes of EIS comparison graphs are now uniformly scaled, and the object manager displays the test name.

- New CV graphs added:

- We have improved the tooltips in the specimen dialog to be less intrusive. Now, only one tooltip is displayed at a time, preventing multiple active tooltips from blocking your view.

| Bug fixes: – Fixed a bug where specimen parameters from the file header of Biologic/Neware files were not correctly applied during graph calculations. – Resolved issues causing problems when merging Neware files. – Hangke formation tester files didn’t show the Excel sheet names in the legend. |
- Perform automated pulse / hppc fits and receive insights on electrolyte, concentration and charge transfer resistance. More information: M. Daowd et al., Battery Models Parameter Estimation based on Matlab/Simulink, International Review of Electrical Engineering, 7(4), 4915-4924.

- New: Analyze Battery Safety Tests! Data Analysis now supports data loggers with multiple channels to record voltage, pressure, and temperature at various cell or module positions. Easily determine onset temperature, emitted gas volume, and maximum temperature. If you conduct safety tests, feel free to contact us!

- DCIR – new single and comparison graphs

- Constant Current – Constant Voltage (CC-CV): Gain deeper insights into the capacity distribution at each stage

- Enhanced Split Graph Feature: Easily extract individual curves from a graph into separate graph objects. This feature now supports a wider range of graph types.

- Graphs with an x-axis based on cycle ranges can now be duplicated or multiplied, each with a defined cycle range to focus on specific test sections.

- EIS graphs can now be selected via the Graph Control tab, and new EIS graphs have been added.

- Improved support for various test devices e.g. Maccor, Neware, Gamry, Solartron,…
To enhance data security, we have replaced passwords with tokens. Tokens are now required to connect Data Analysis, Collect, and Mind, as well as to access the API with your own code or third-party software. After updating Data Analysis, Collect, or Mind, you must create and use tokens. Your Collect and Mind login passwords remain unchanged and are still required.
For general information, please watch the basics video, and for detailed instructions, refer to our tutorial video.

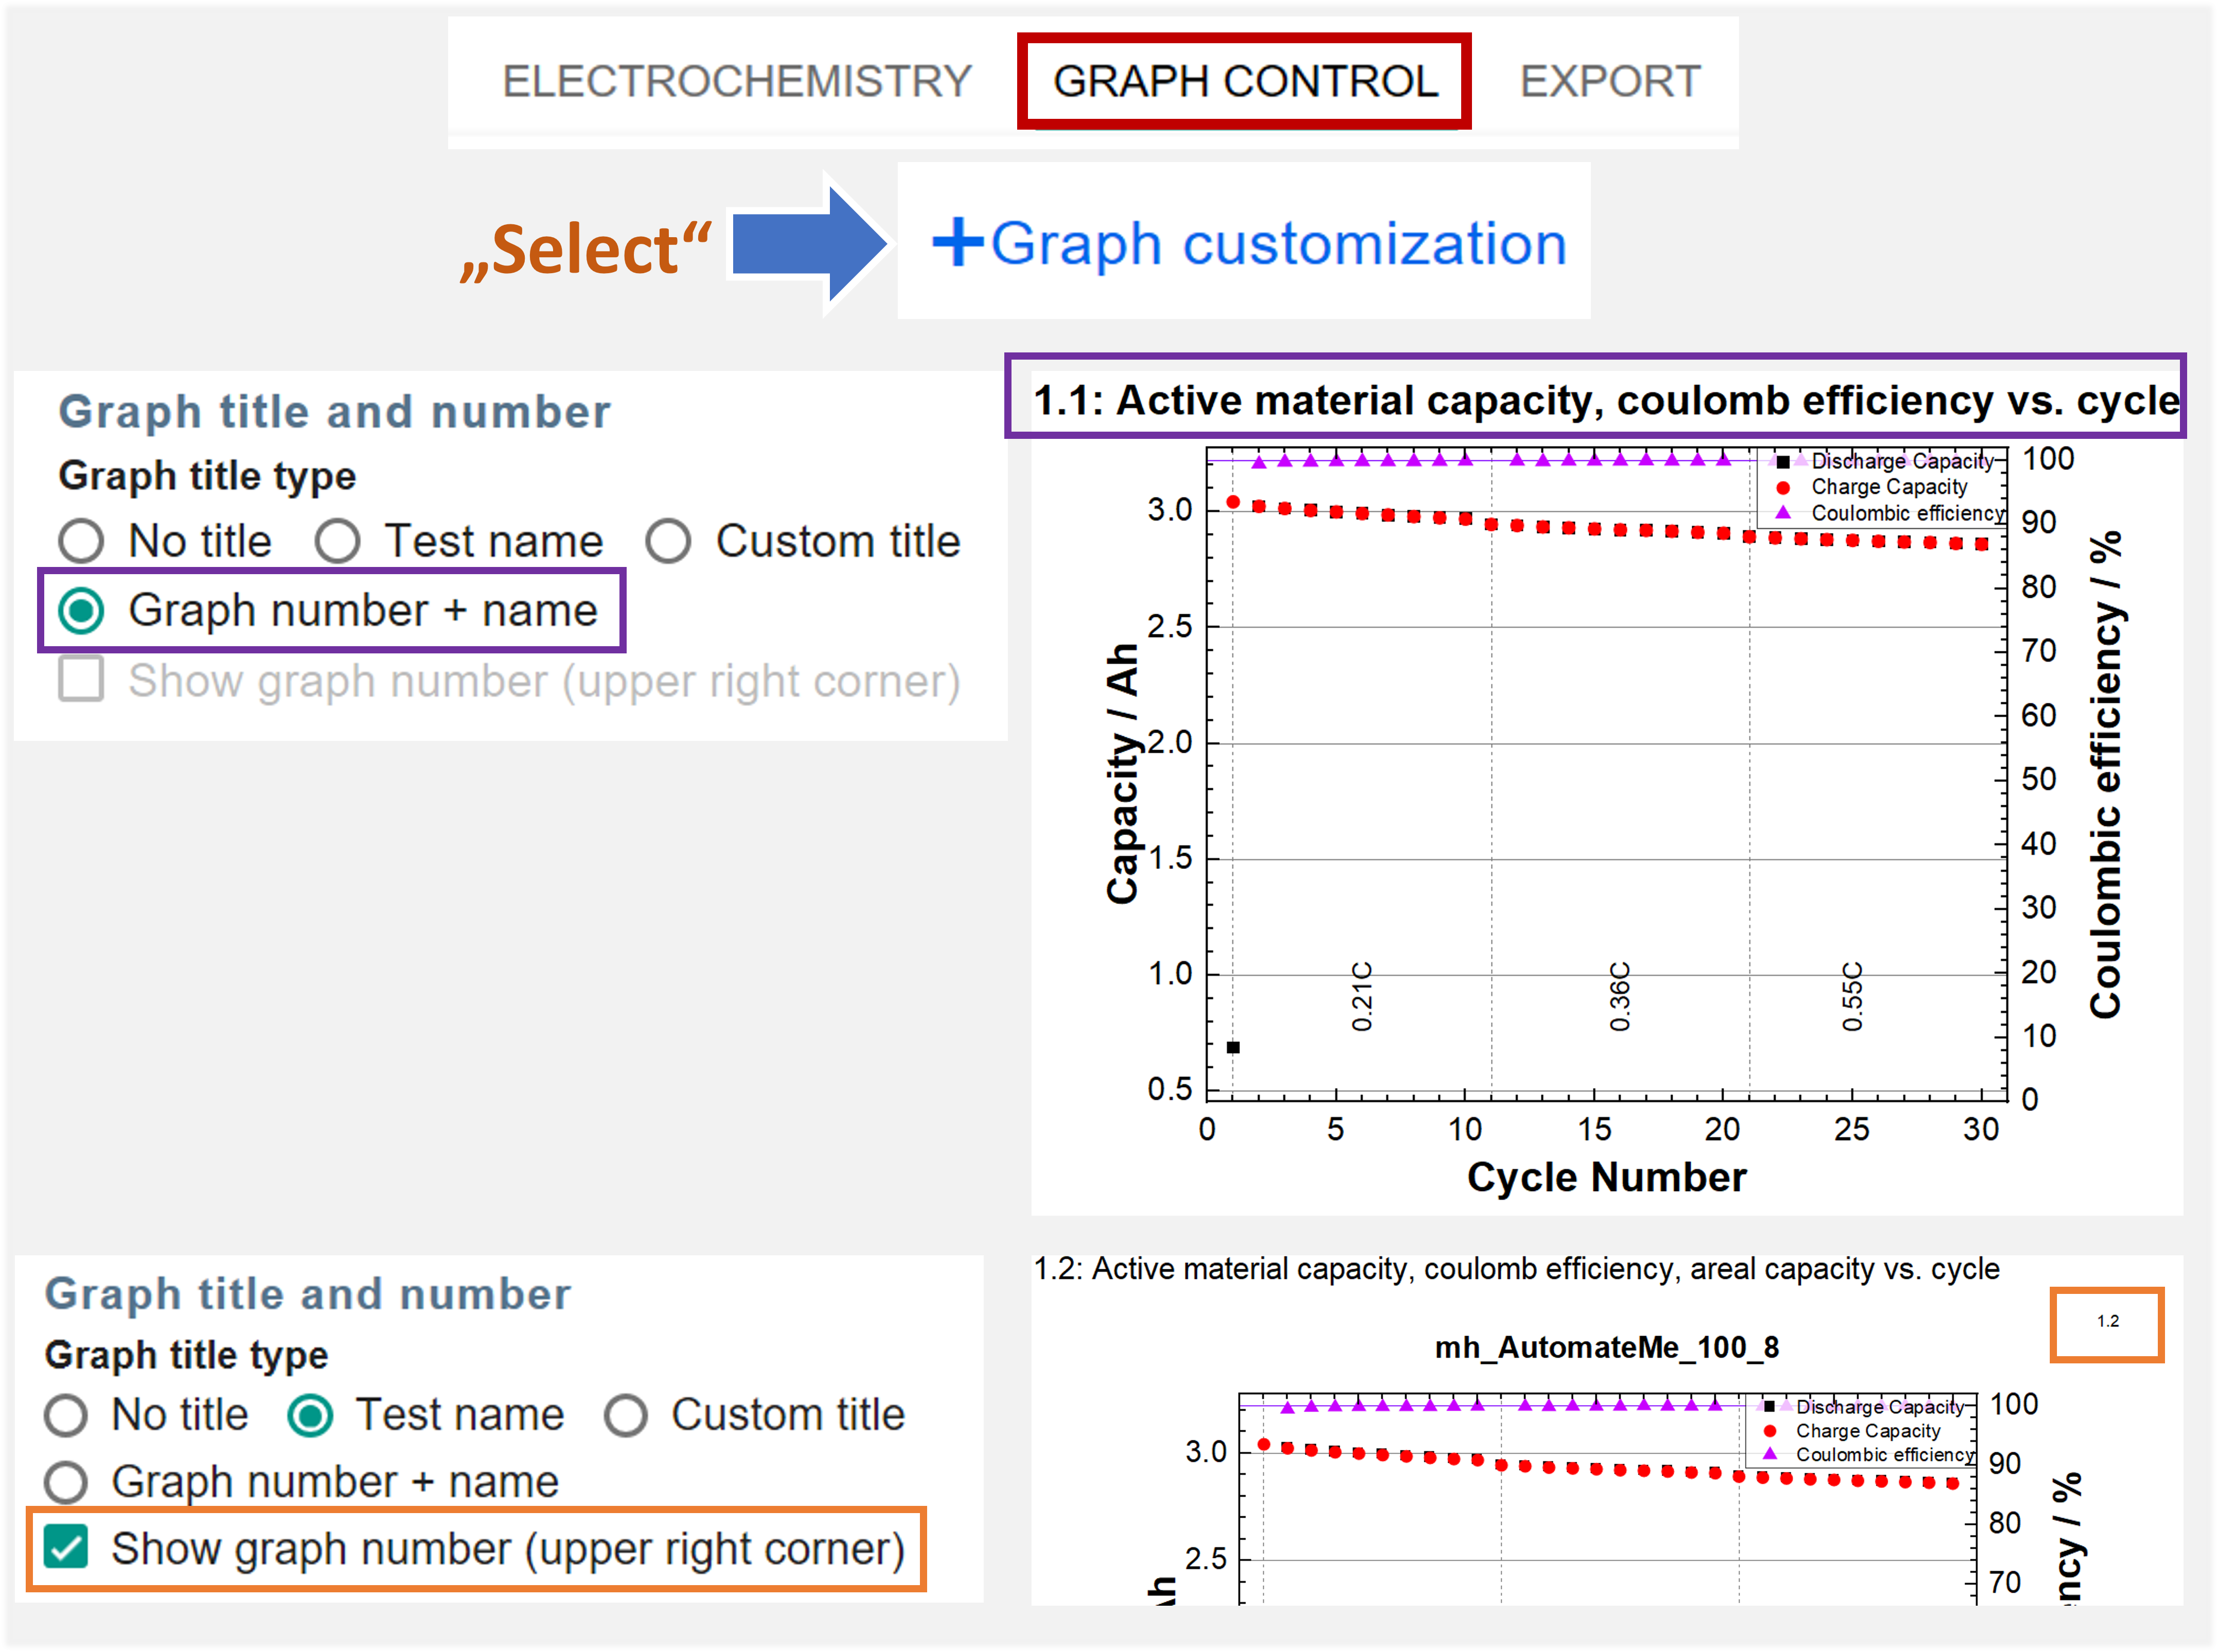
- Graph calculation formulas are now displayed both in Graph Control – Graph selection and above each created graph

- New information dialog

- WE coating thickness – enry added/linked to Basic Parameters section

- Comparison graphs: new error display style added. With “None” only the standard deviation is plotted.

- Curve colors can be edited more easily now (only from Origin2024b)

- New Graph Control option: Show/hide vertical reference lines

- New comparison result graph added: Discharge capacity, CE vs. cycle comparison

- Improves support for various test devices
- Improved merge feature
- New graph customization option #1: Select individual color for Voltaic and Energy efficiency and adjust efficiency axis range(s) and increment(s)

- New graph customization option #2: (De)Acitvate graph gridlines

- Coin cells (CR1616 and CR2032) added to the Cell format section

- File name is now displayed in Collect monitor

- Password entry in Data Analysis to connect to Collect is by default hidden

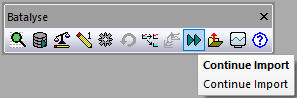
- Improvements and bug fixes with the Data Analysis continue import function in combination with our Collect database software.
- Improvements for EIS analysis:
- x/y axis now have the same scaling
- Curves have different color
- Resistance is now normalized to electrode area if added in dialog
- Improvements for EIS analysis:
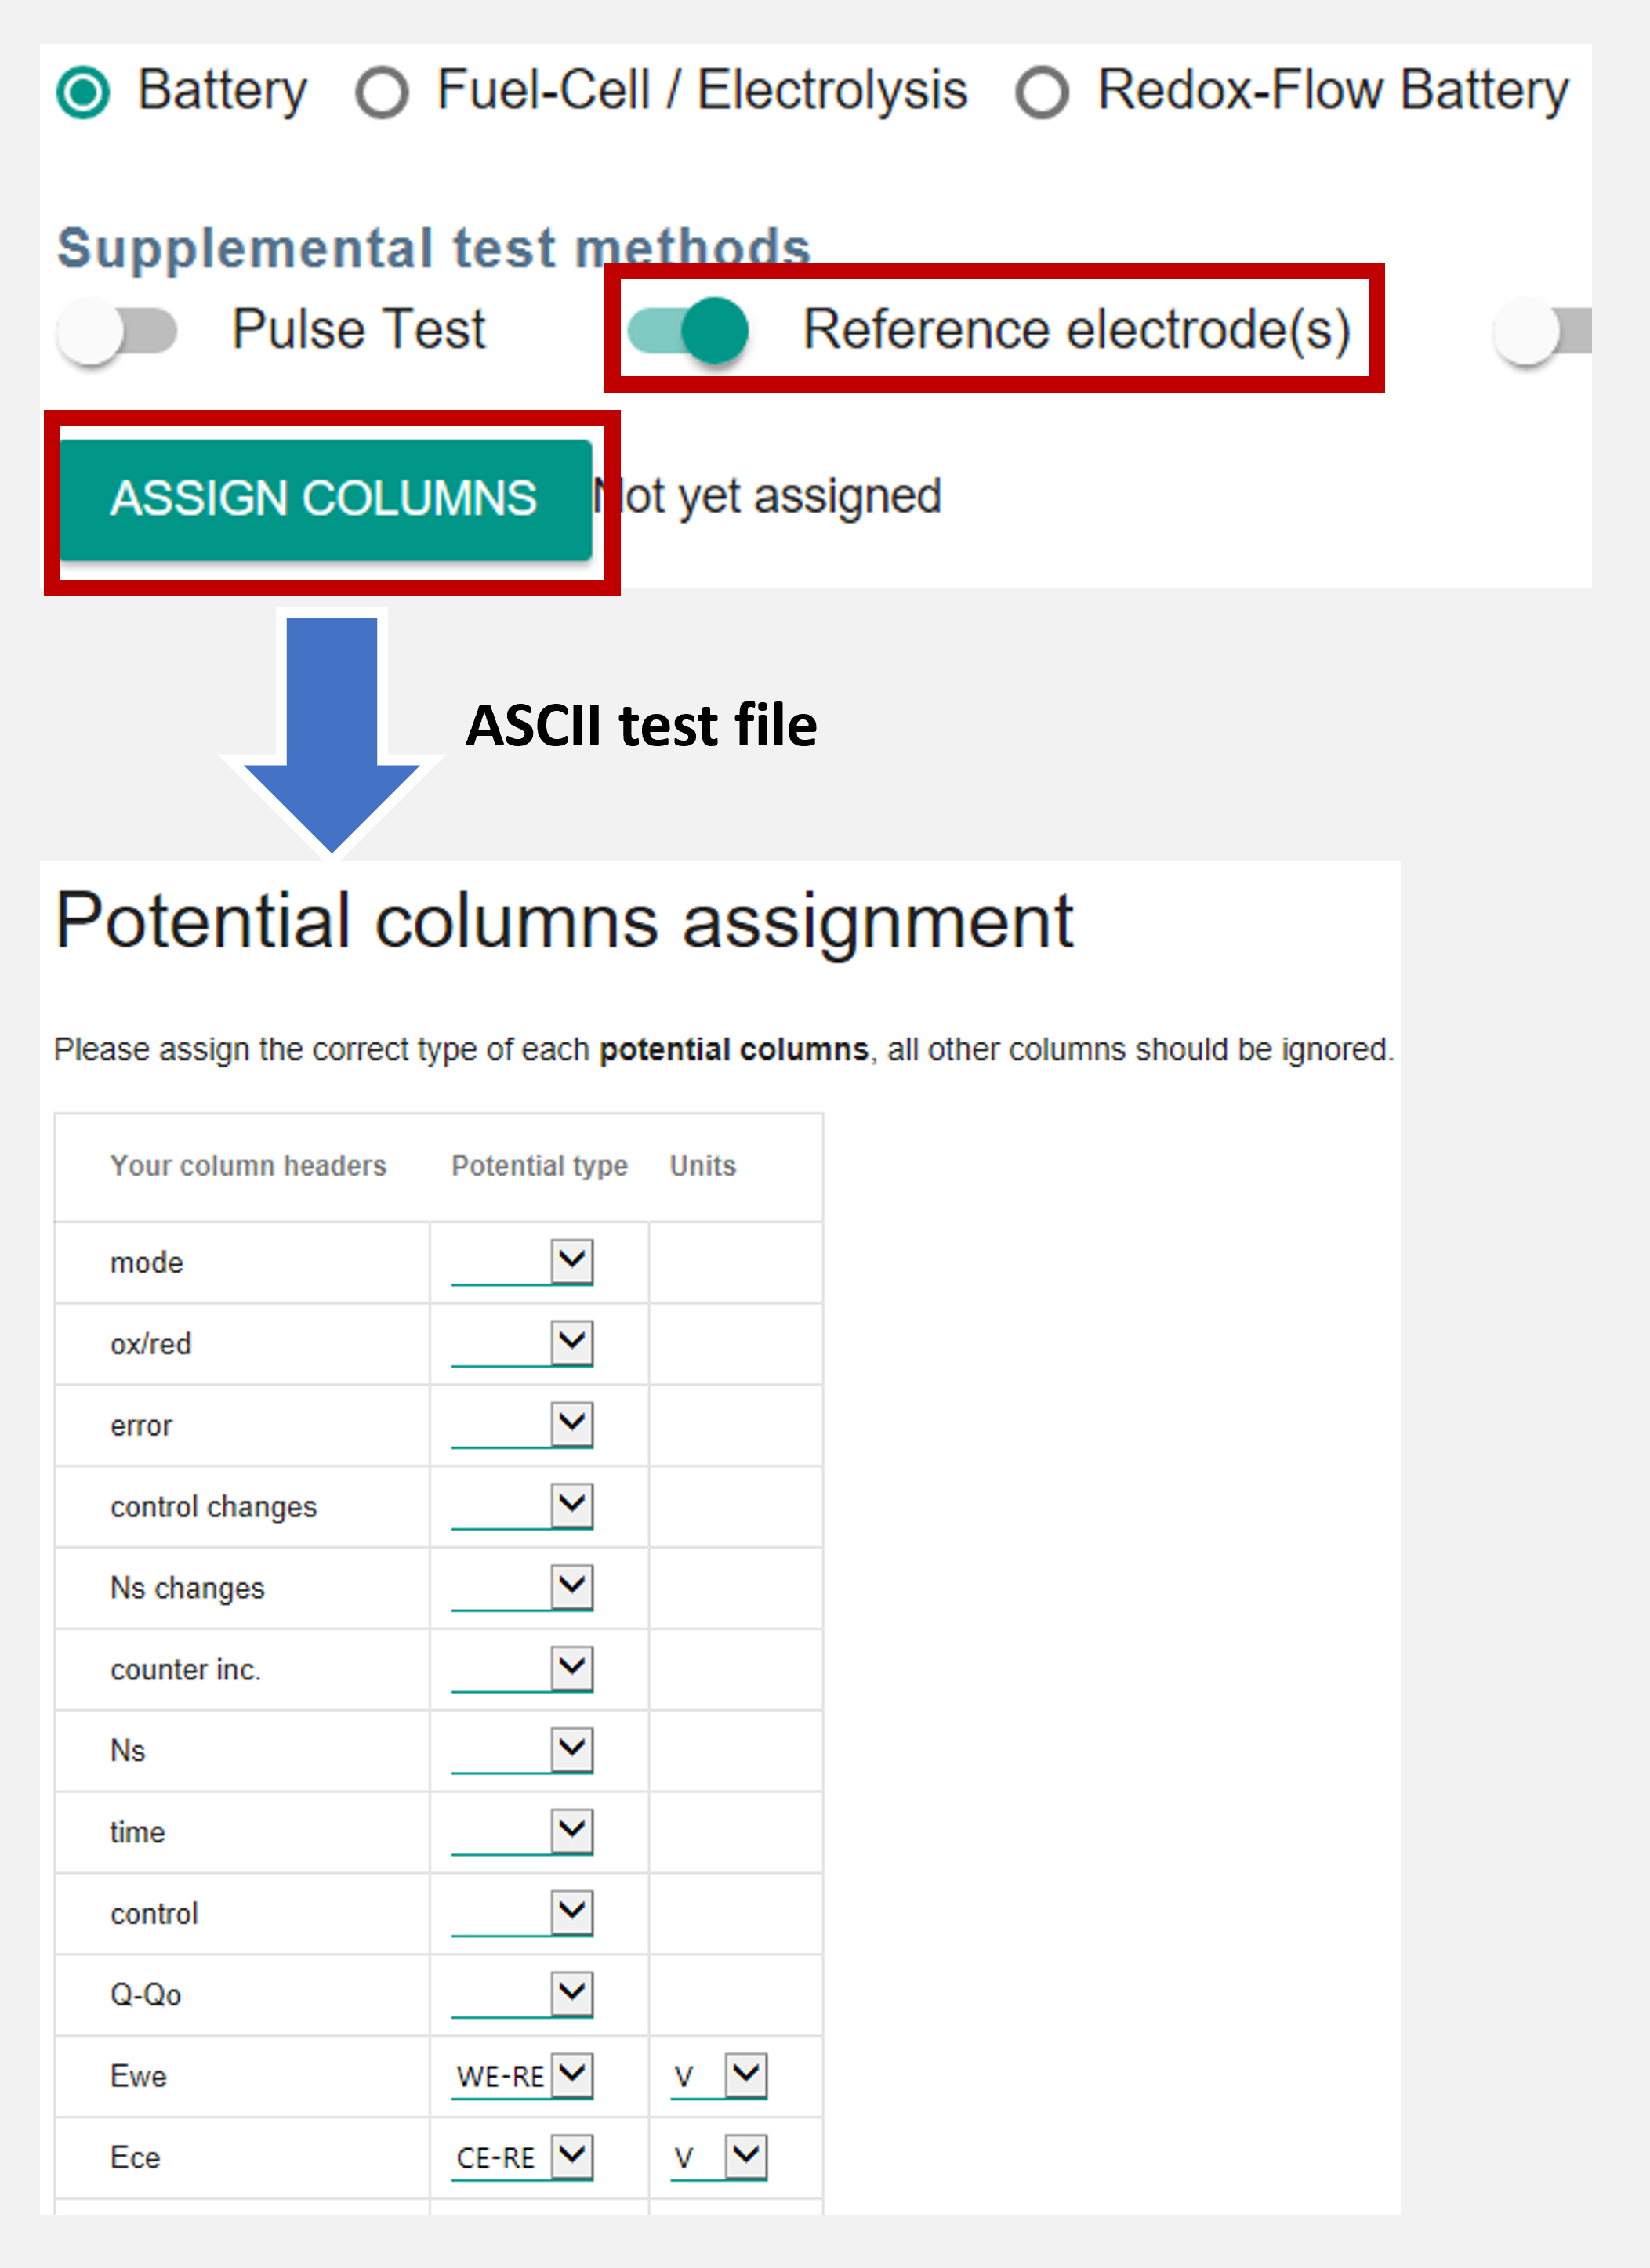
- Reference electrodes
- New reference electrode result dQ/dV graphs
- WE-RE voltage at x and y axis
- CE-RE voltage at x and y axis
- New reference electrode result dQ/dV graphs
- You can now also directly assign your test file columns when working with Biologic mpr files. Please update your mpr connector to the latest version.
- Reference electrodes

- New support for Galvanostatic intermittent titration technique (GITT) tests

- Added support for Battery Dynamics test devices
- Improved support for Neware, Astrol, Ivium, Maccor and Nanocycler test devices
- Data Analysis v2024-04 uses a Python package to accelerate the upload of results to Batalyse Collect database. This is only relevant for you if you use both Data Analysis and Collect. Please accept the installation of the Python package in that case.

2024.02 (updated 18.04.2024)
- Search and filter your result graphs
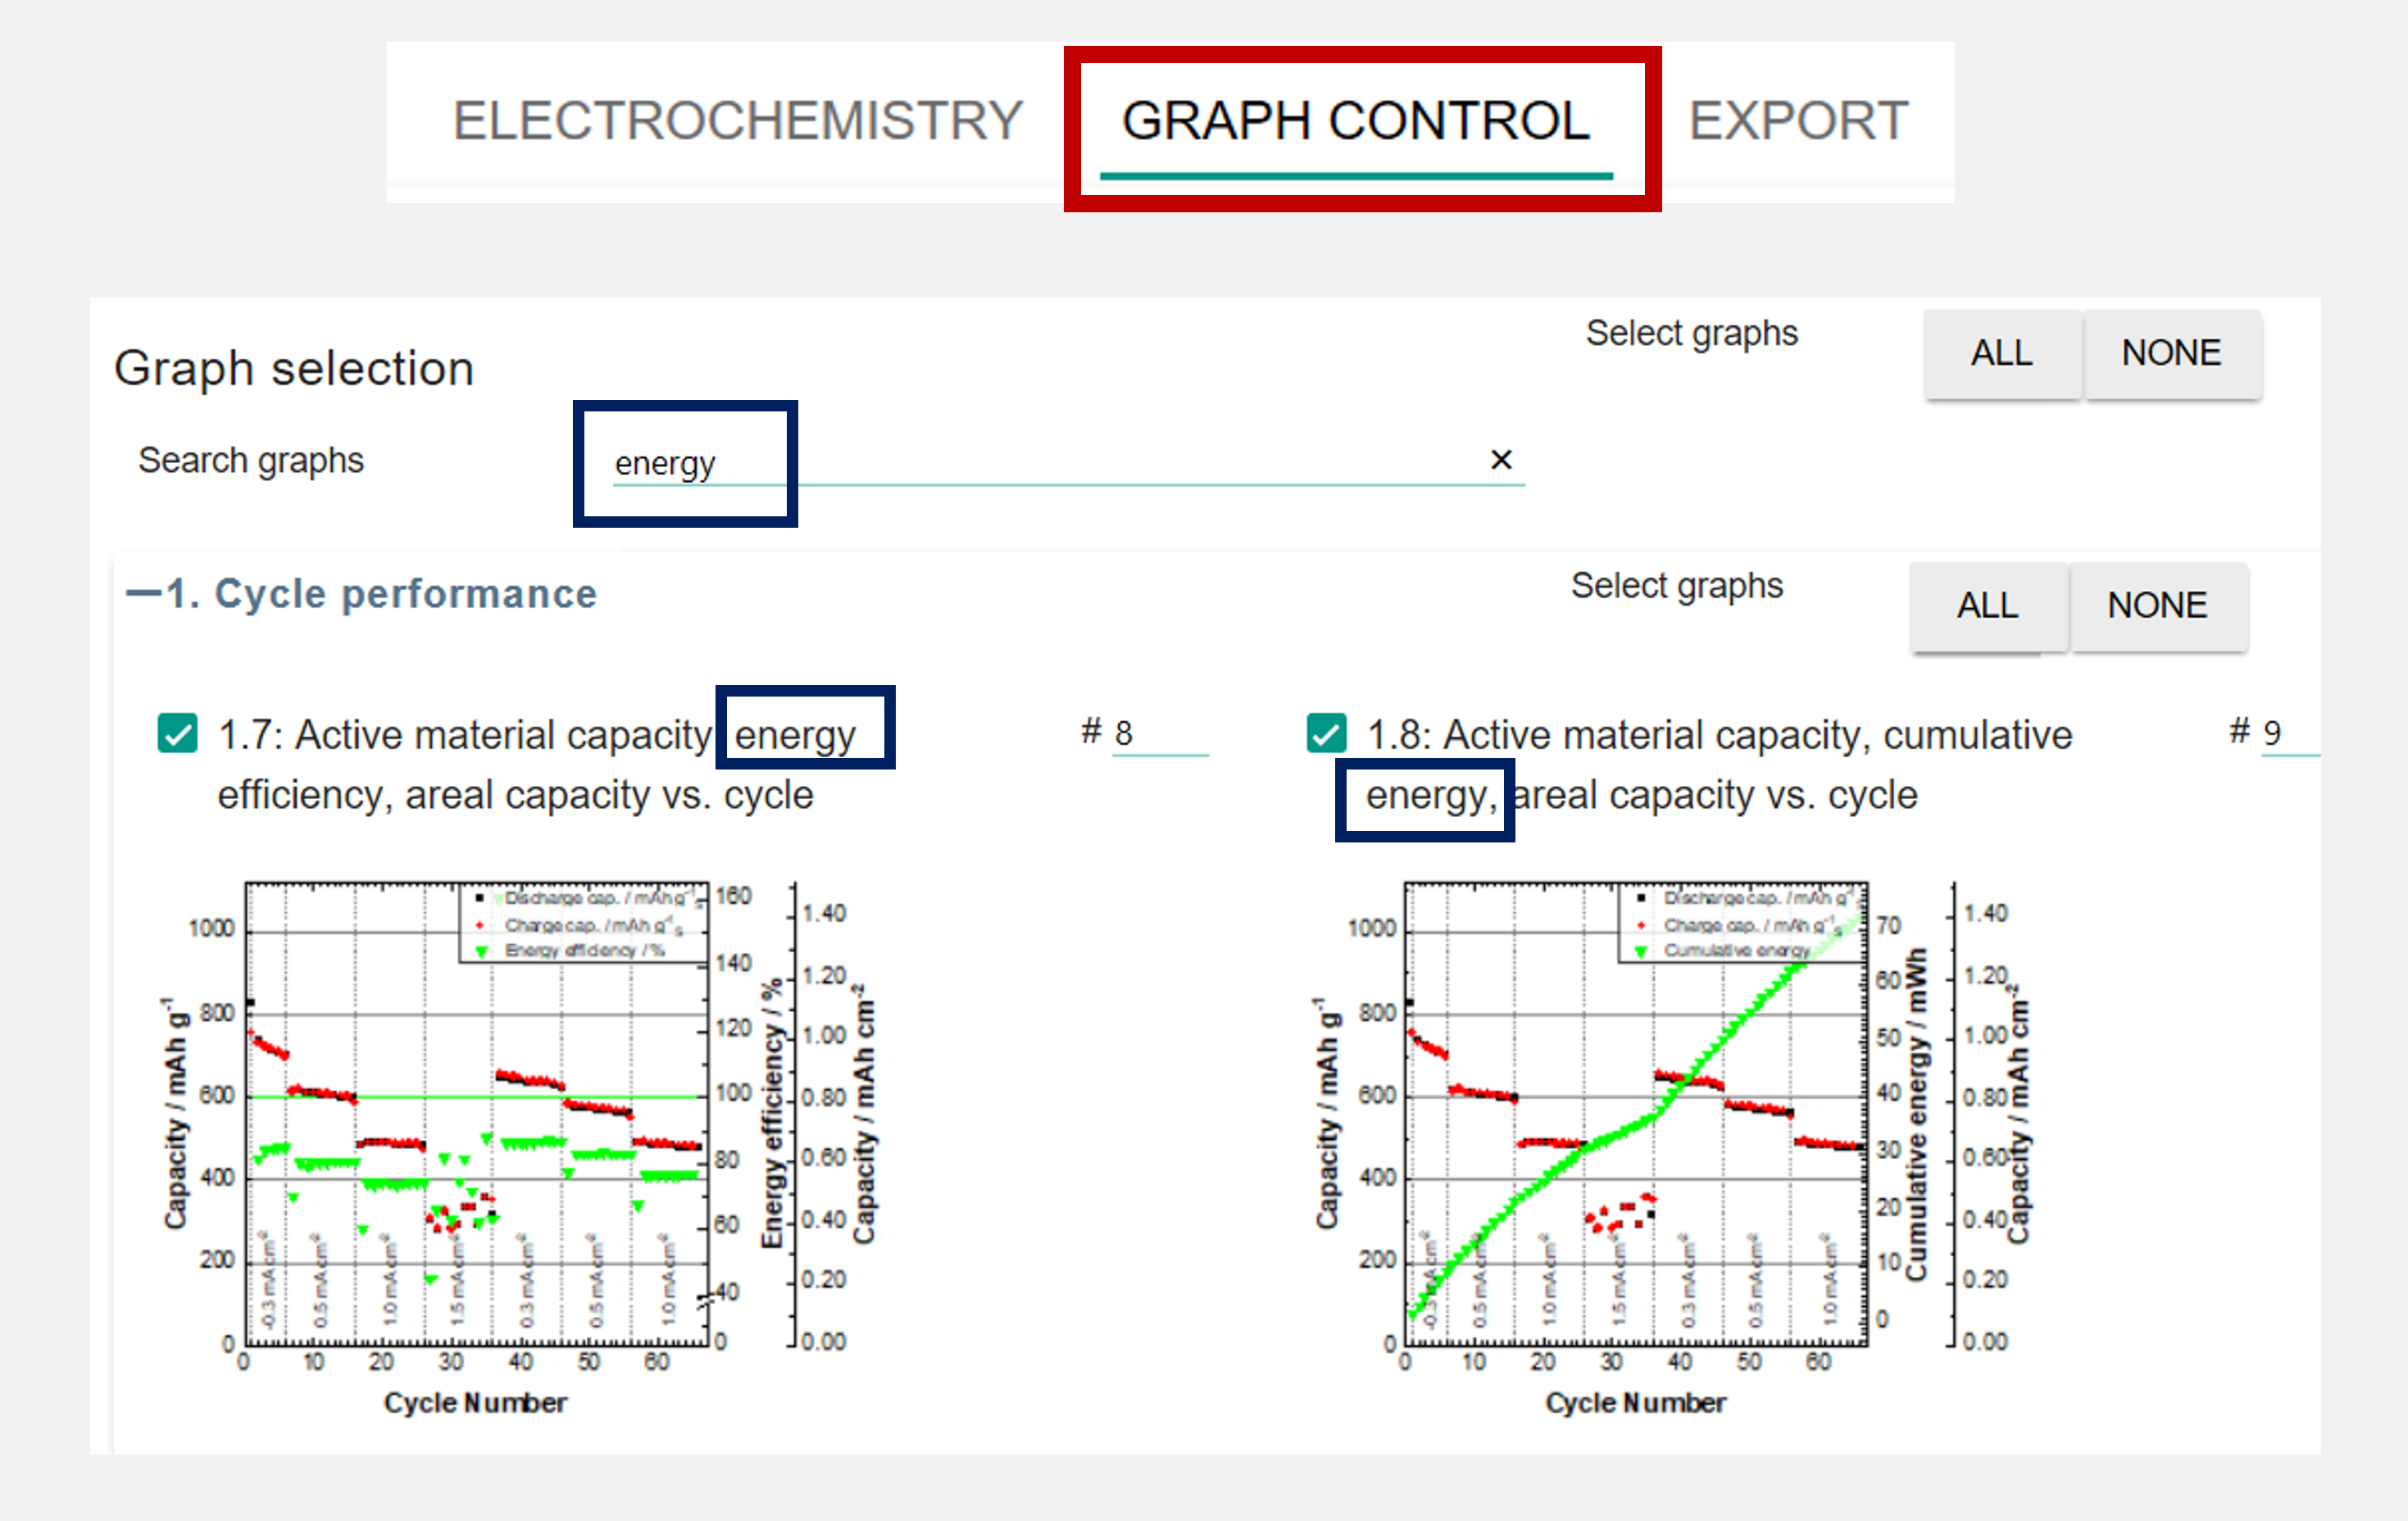
- Identify your result graphs easier and faster by the graph number
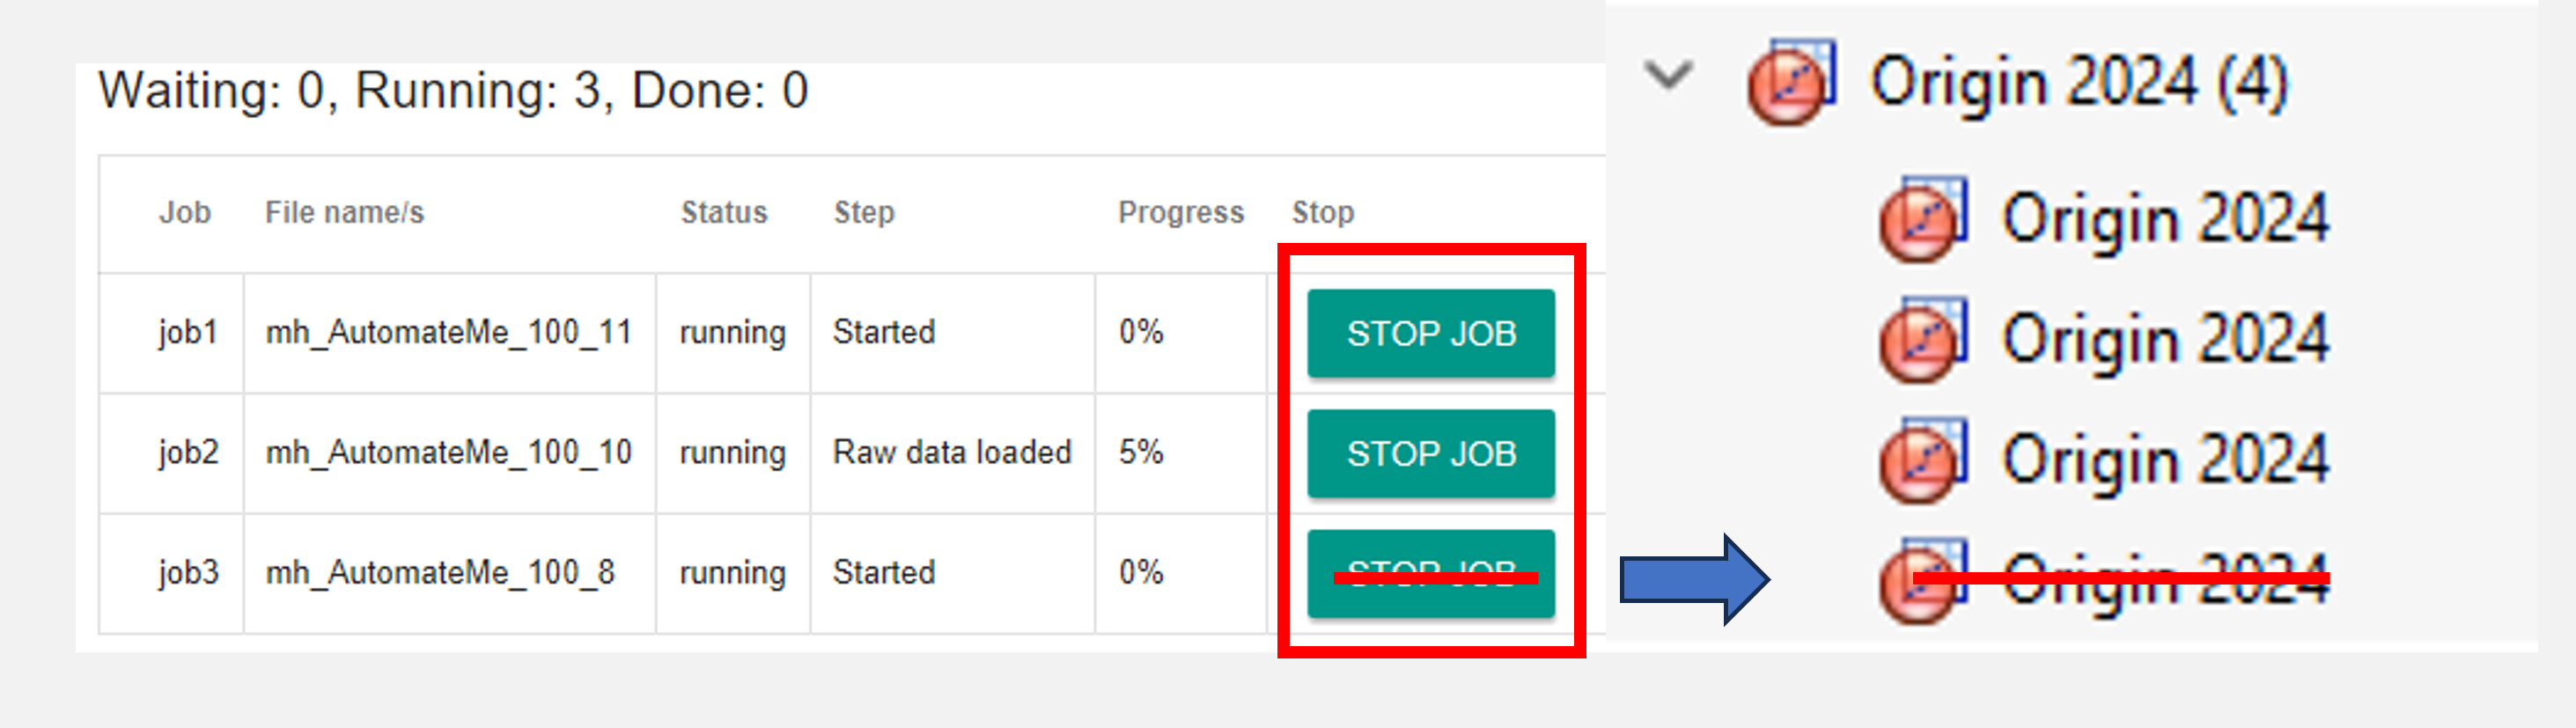
- Skip Evaluation → Stop Test – The feature to skip an evaluation when Data Analysis evaluates multiple test files was improved to stop the test more reliably. All corresponding Origin background processes are terminated.
- Improvements and bug fixes with the Data Analysis continue import function in combination with our Collect database software.
- Improved support for tests with reference electrode. The new Assign Colums feature allows editing your input in advance and after the evaluation process.
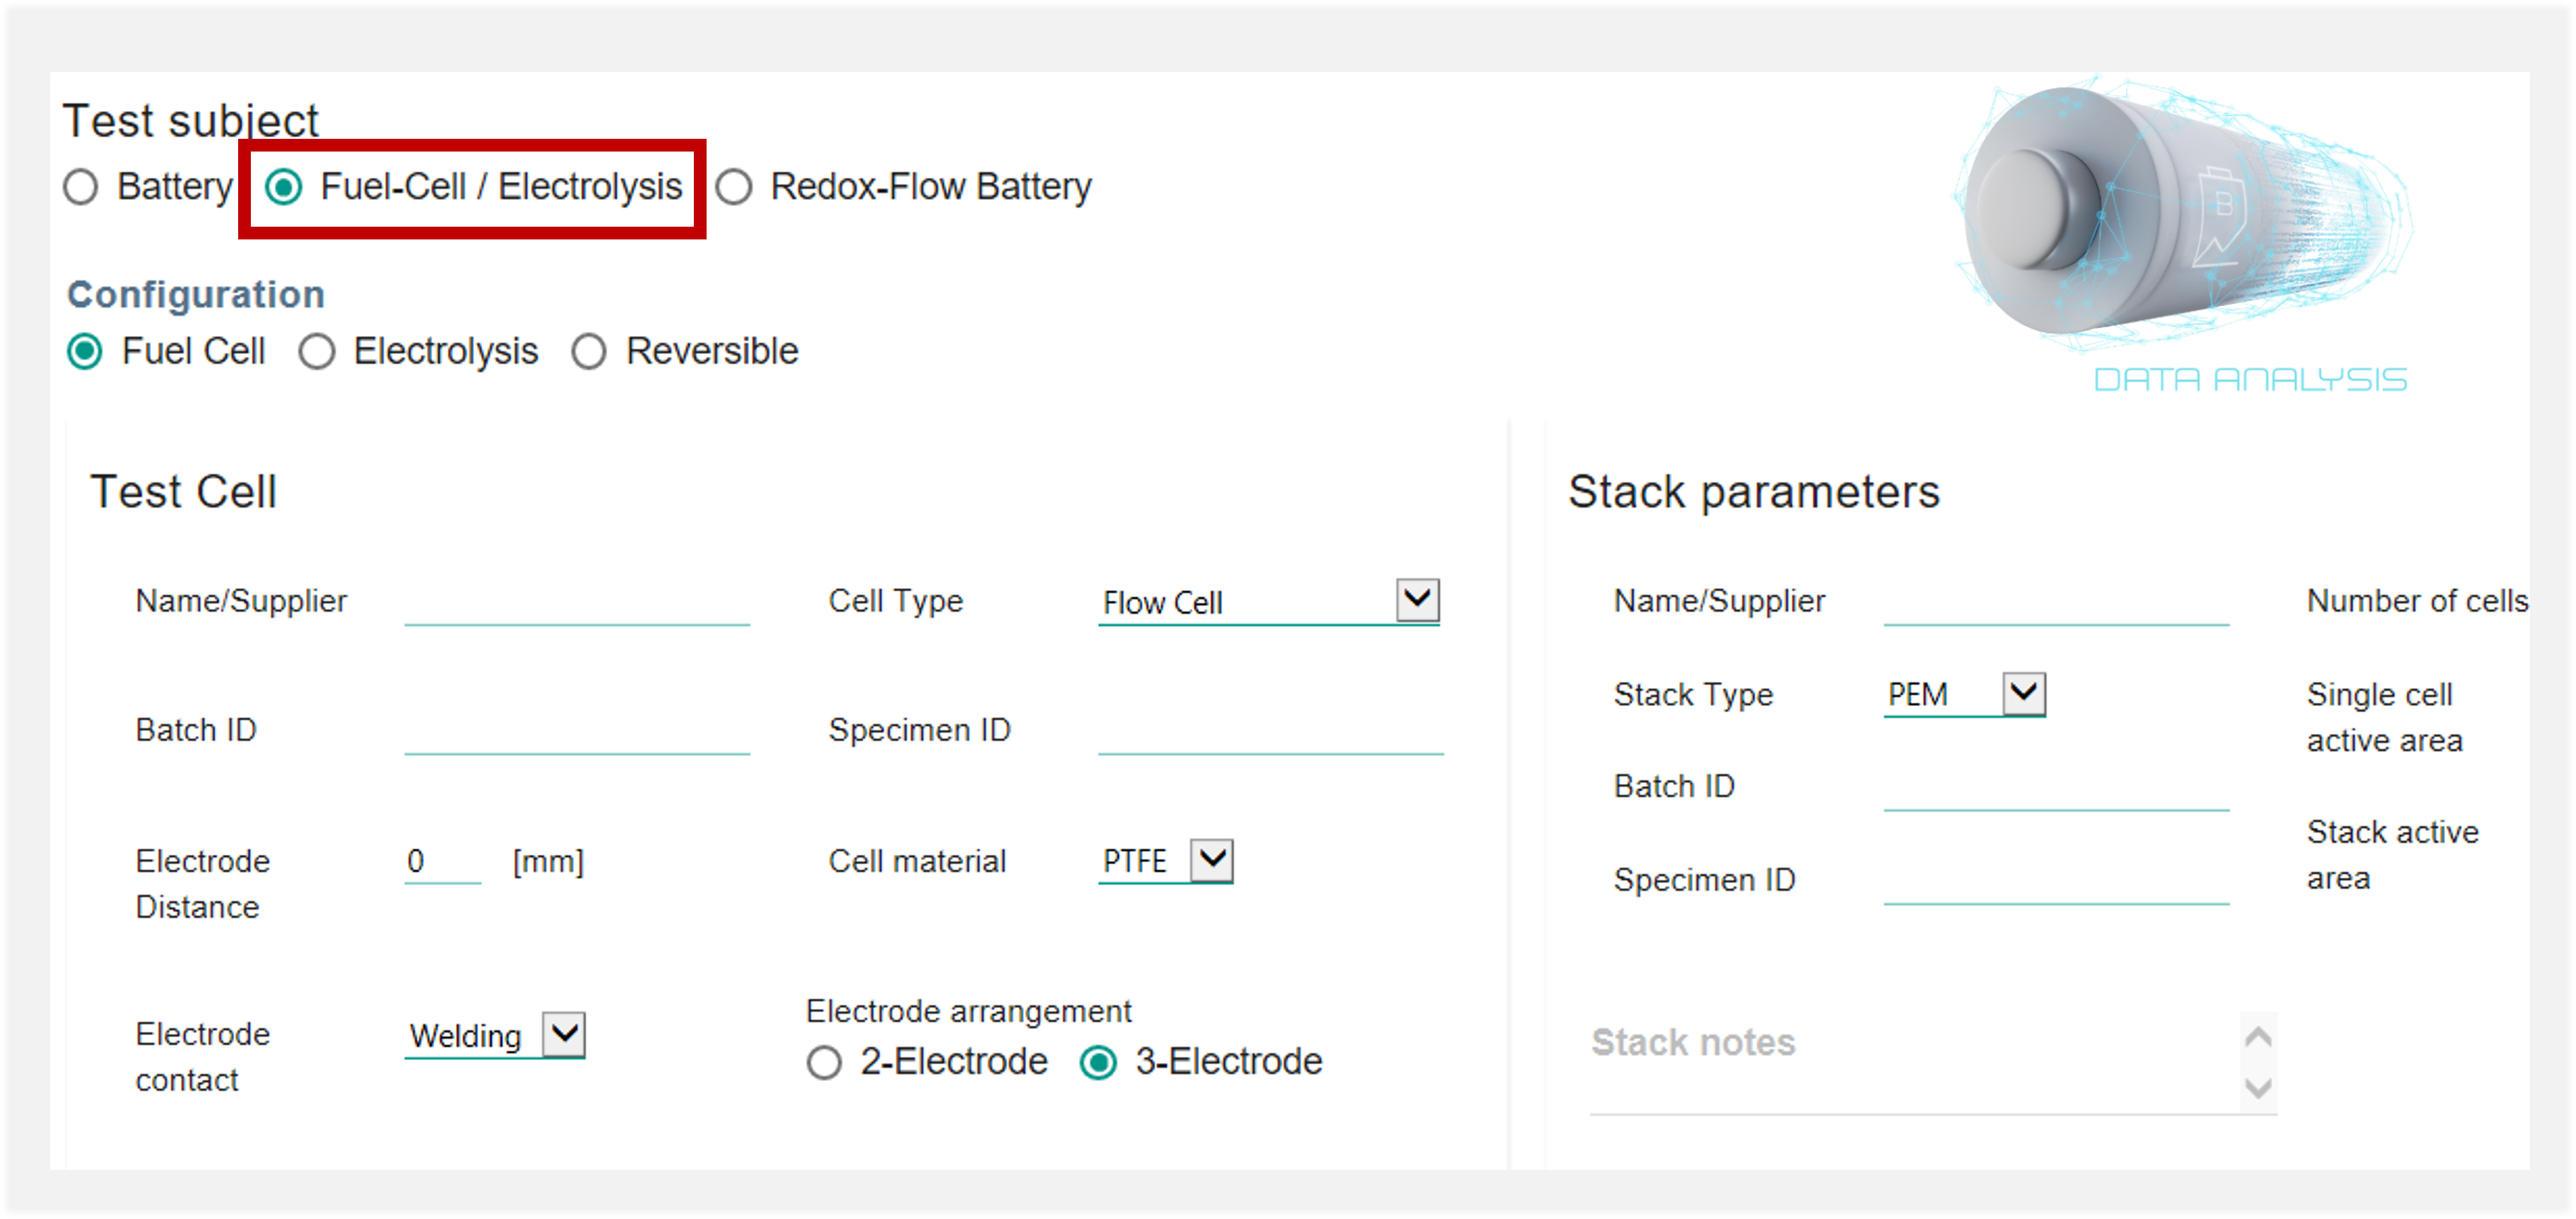
- New Fuel-cell / Electrolysis specimen dialog and parameters management
- New Origin connector to work with Lanhe/Landt .cex files. You can now also directly evaluate these .cex files with Data Analysis!
- Added new volumetric capacity comparison graphs
- Improved/updated support for many cyclers, multiple bug fixes and support of new file structures
2024.01 (updated 23.01.2024)
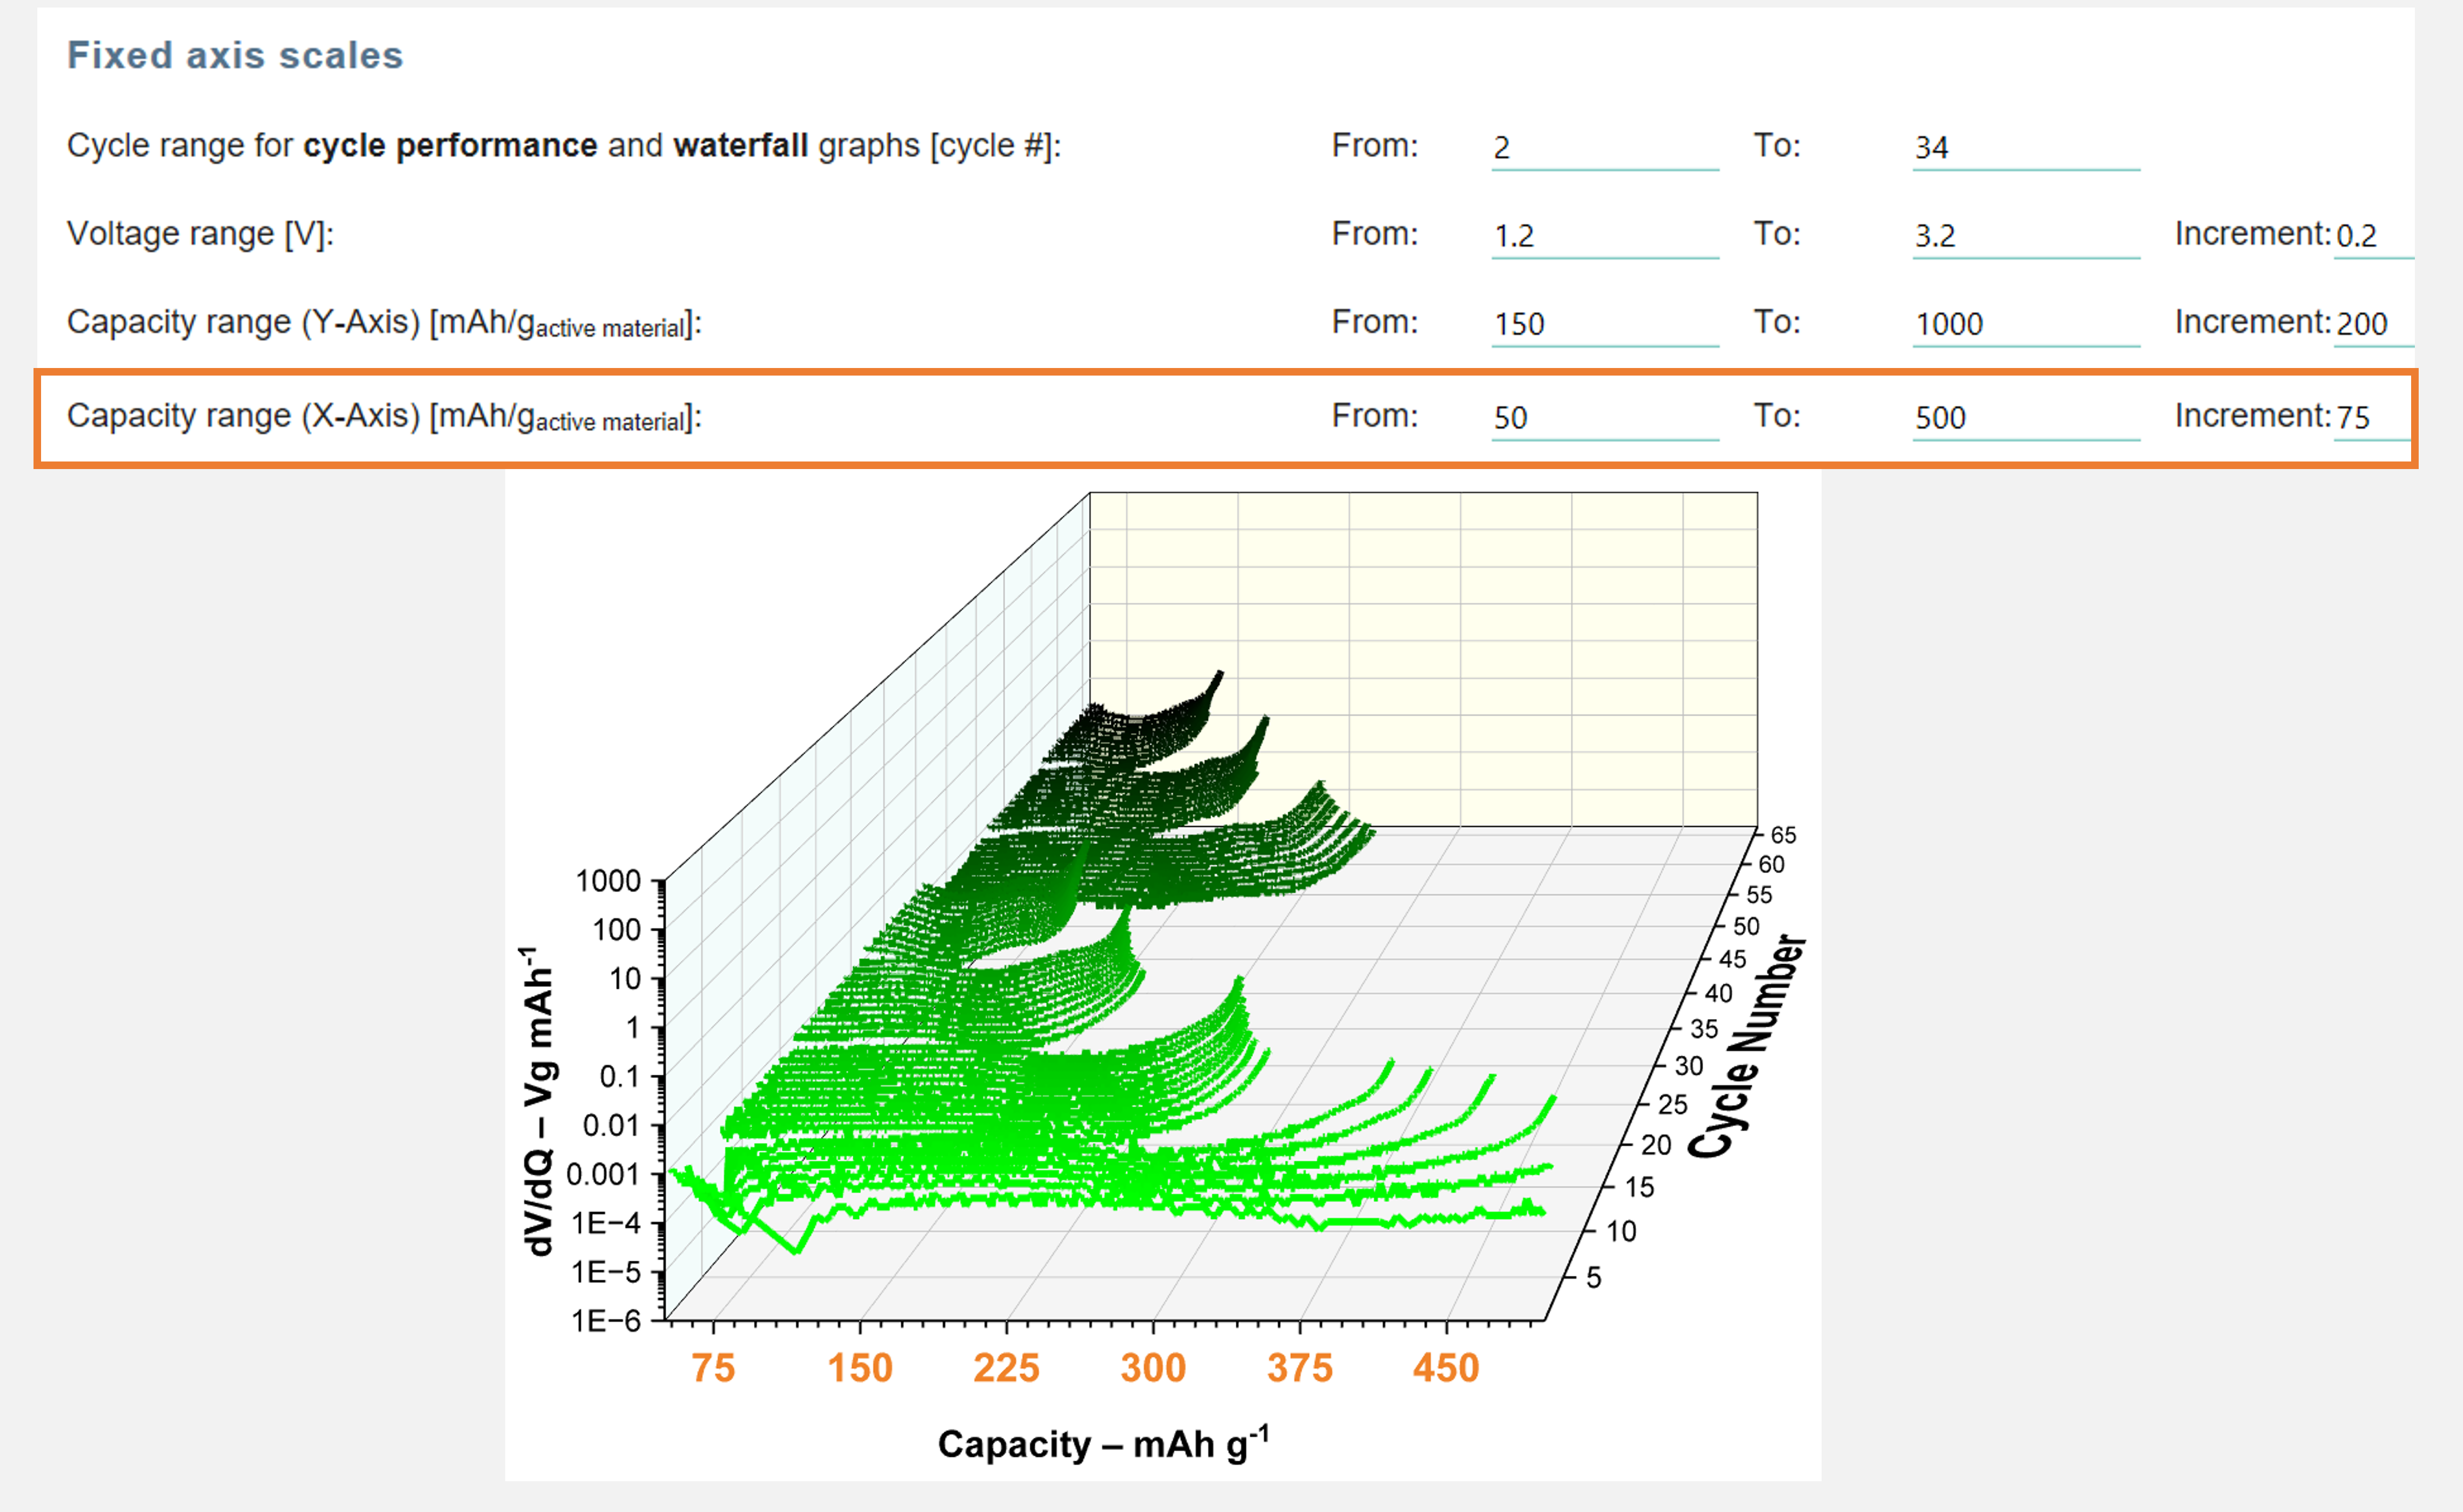
- Added an option for fixed X-axis scale for Capacity Axis
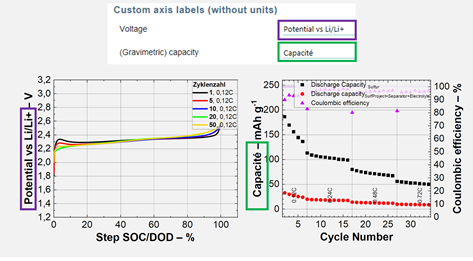
- Added an option for manually specifying axis titles for voltage and capacity axes
- Improved volumetric capacity graphs
- Hangke + Multi channel LVDT import support (from Collect)
- Fix support for capitalized “MPR”, “XLS/S” file extensions
- Comparison CC-CV graphs
- Bug fixes
2023.09 (updated 08.11.2023)
- Added voltage areal capacity comparison graphs
- Fixed “skip” function for collect-monitor, general improvement to “skip”
- Prevent some dialogs from opening in the background and halting the process
- Collect monitor error and progress improvements
- Improved test type detection
- Prioritize selected cycle for 100% Capacity and SOC over Nominal-Cap
- Support Maccor files with Voltage in µV
- Added axis title units separator and parts selection
- Coating and stack volumetric capacity comparison
- Support extracting active material and nominal capacity from some Neware file formats
- Added option to separate charge/discharge curves graphs
- Added option to load graph style from template
- Added option for fixed capacity/voltage scale ranges
- Added line thickness and symbol size and color selection
- Bug fixes
2023.08 (updated 15.09.2023)
- Added dVA (dV/dQ) graphs
- Improved merge functionality to allow merging files with different columns, i.e. for different BioLogic methods
- Improved pulse graphs
- Added minimal dV ranges for differential graphs smoothing
- Relative loss + discharge capacity graph
- New option for selecting cycles to display with offset, i.e. you can enter 2+10 to show cycles 2, 12, 22…
- Improved waterfall diagrams
- Improved Ivium and BioLogic support
- Improved and fixed thickness measurement graphs, ability to merge thickness measurement data
- Multiple bug fixes
2023.06 (updated 17.07.2023)
- Added voltage vs. areal capacity graph (single tests)
- Added end-of-charge/discharge-voltage graphs (single tests + comparison)
- Improved “Merge” function to support merging of additional file structures
- Added “Load” and “Export” Buttons to specific components inside the parameters dialog
- Improved 3-electrode diagrams
- New entry fields in the parameters dialog – notes, porosity, temperature and pressure
- Accuracy improvements for step type recognition and average current calculation, especially for steps with few data rows
- Multiple bug fixes
2023.05 (updated 11.05.2023)
- Added voltage vs. areal capacity graph (single tests)
- Added end-of-charge/discharge-voltage graphs (single tests + comparison)
- Improved “Merge” function to support merging of additional file structures
- Added “Load” and “Export” Buttons to specific components inside the parameters dialog
- Improved 3-electrode diagrams
- New entry fields in the parameters dialog – notes, porosity, temperature and pressure
- Accuracy improvements for step type recognition and average current calculation, especially for steps with few data rows
- Multiple bug fixes
2023.03 (updated 21.03.2023)
- Added voltage vs. areal capacity graph (single tests)
- Added end-of-charge/discharge-voltage graphs (single tests + comparison)
- Improved “Merge” function to support merging of additional file structures
- Added “Load” and “Export” Buttons to specific components inside the parameters dialog
- Improved 3-electrode diagrams
- New entry fields in the parameters dialog – notes, porosity, temperature and pressure
- Accuracy improvements for step type recognition and average current calculation, especially for steps with few data rows
- Multiple bug fixes